
The Premier League Rating Table v2
An attempt to validate Sofascore’s ability to accurately measure real-time player performance


Last year I started an experimental series exploring whether Sofascore’s algorithmic rating system could indicate a team’s league position through its ability to measure performance. I introduced a 'Squad Rating'—a combined figure of all individual ratings—then matched each team's score against the final standings. If rankings aligned, it would validate the system’s accuracy. With a new season ahead, it's time for an improved second edition.
Before we start, let’s go through the methodology used to build out the rating tables as I did previously, with a slight few alterations.
Methodology
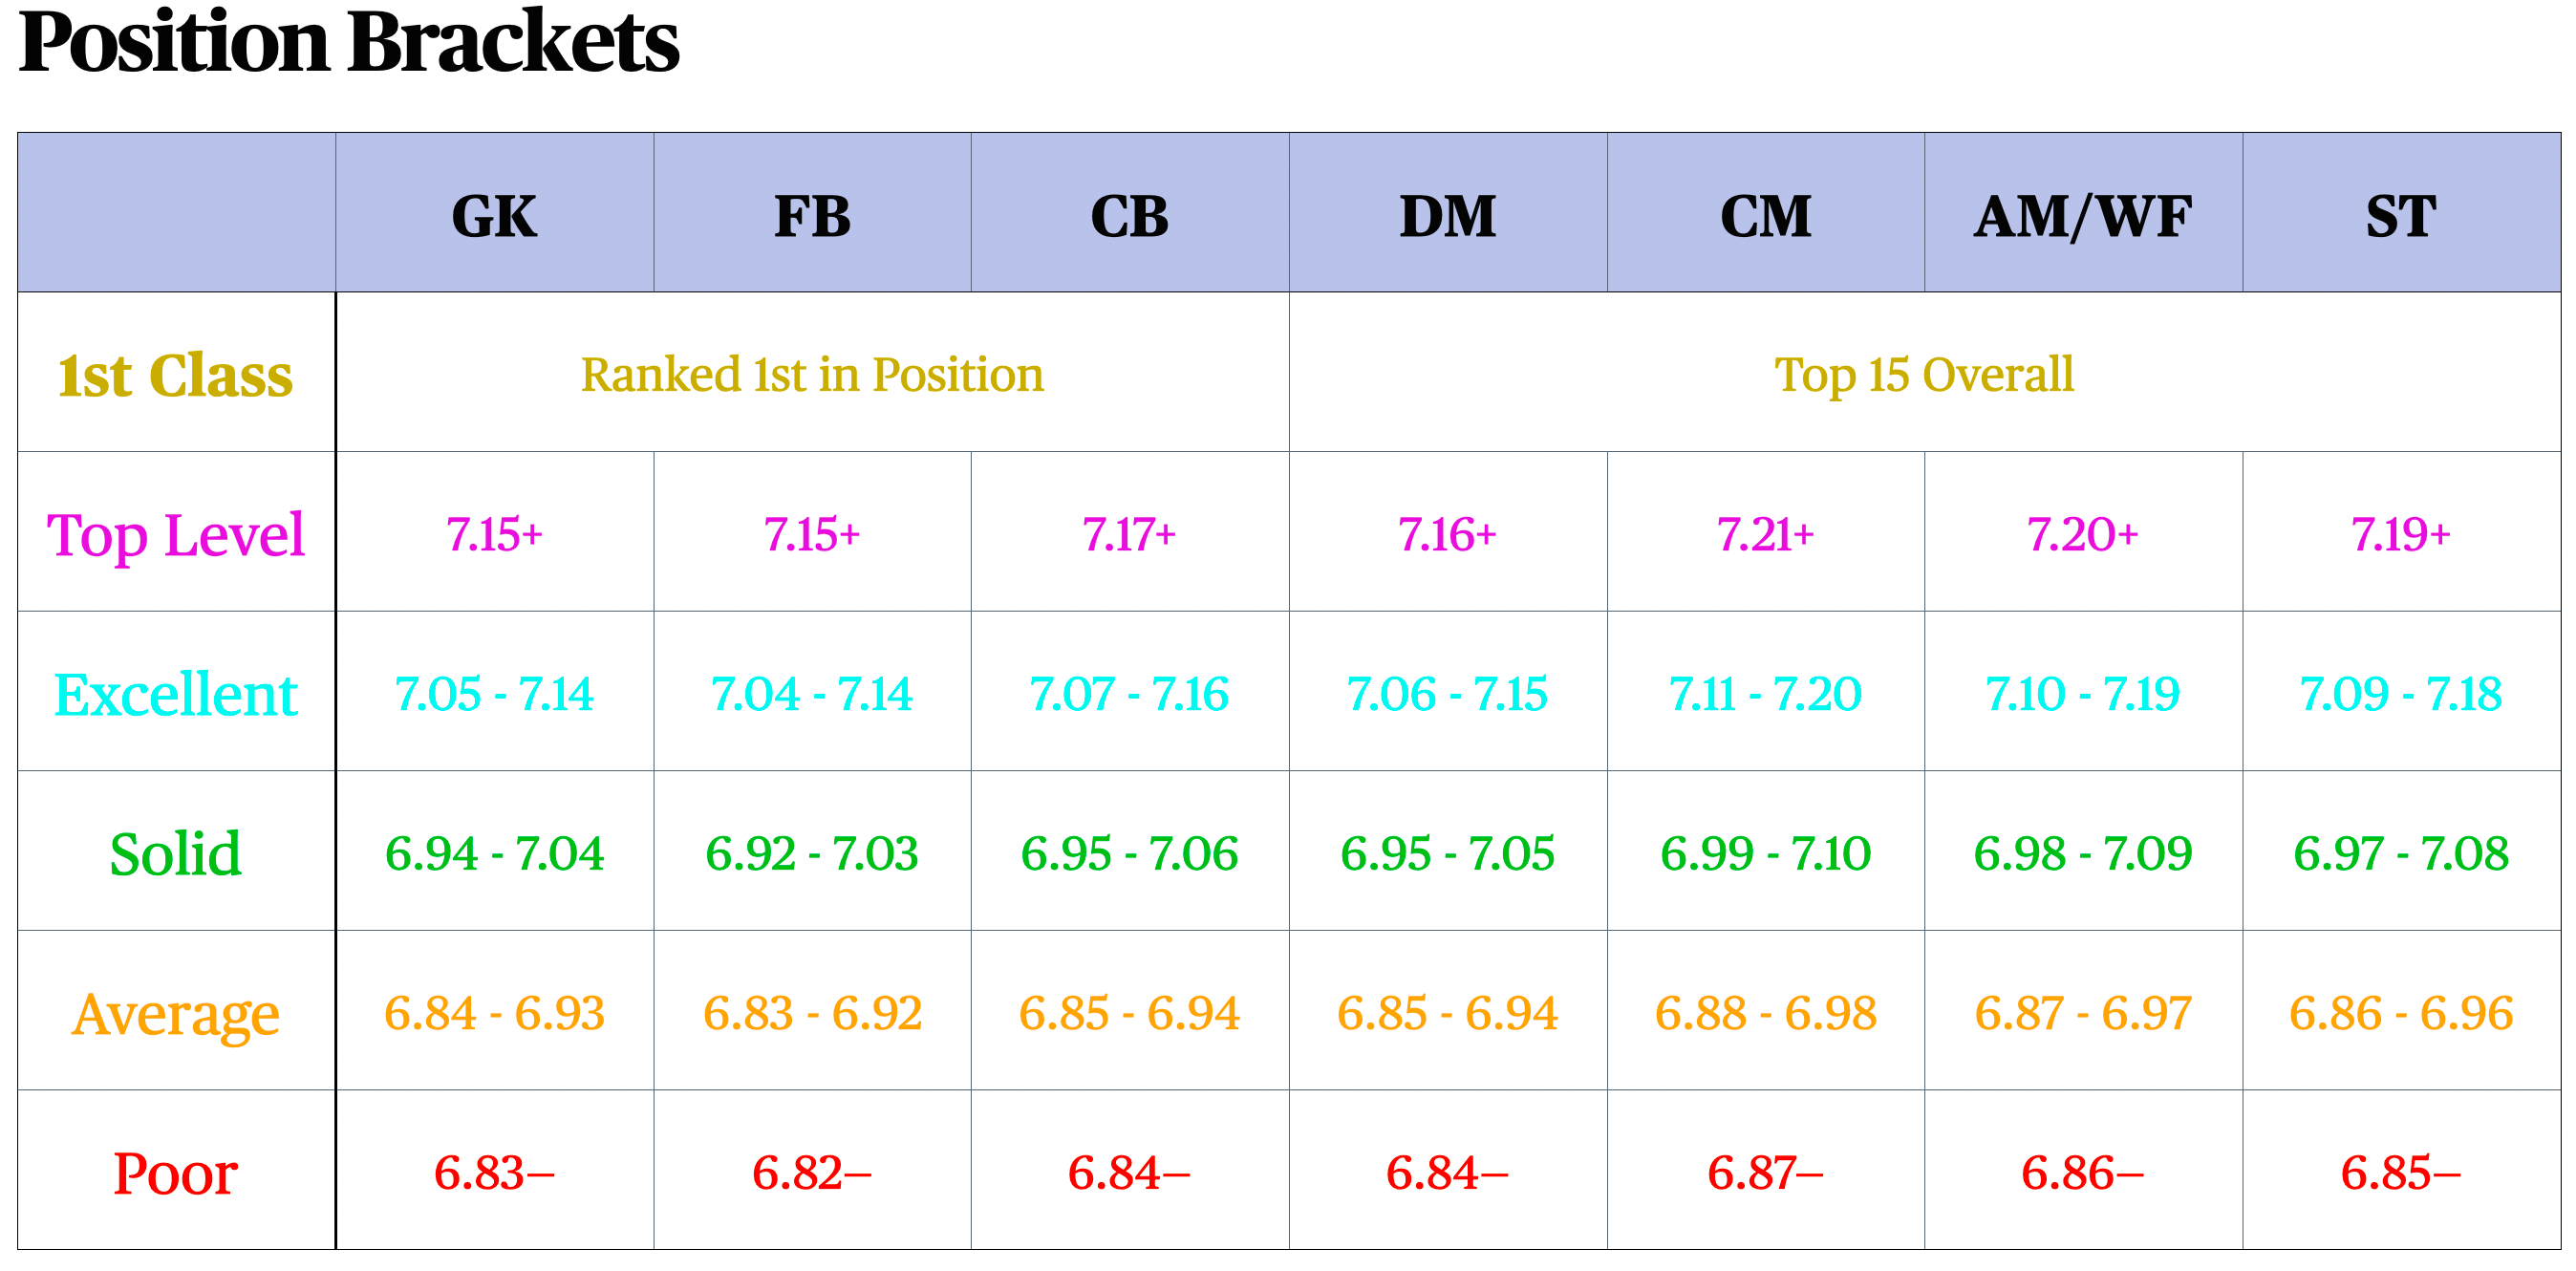
Step 1: Create Rating Brackets — Simply averaging player ratings misses key nuances. For example, a 7.21 rating might rank a CB first but place a winger only 15th. To create a more accurate squad rating, we need to weight each position, ensuring the final score better reflects the team’s collective performance level.
Compile player data into a spreadsheet to calculate performance ranges.
Name and create performance tiers.
For each position calculate a relevant tier range.
Assign score to each tier.
Colour code tiers for visual understanding.
Step 2: Convert each rating into their respective score
Go through each team and record each player rating (18 players).
Refer to the rating brackets, colour coding each player into their correct tier.
Count how many of each colour and start to tally up the figures for each tier.
Add up all 18 scores until final squad rating.
Calculate a starting 11 rating of the players who were used the most.
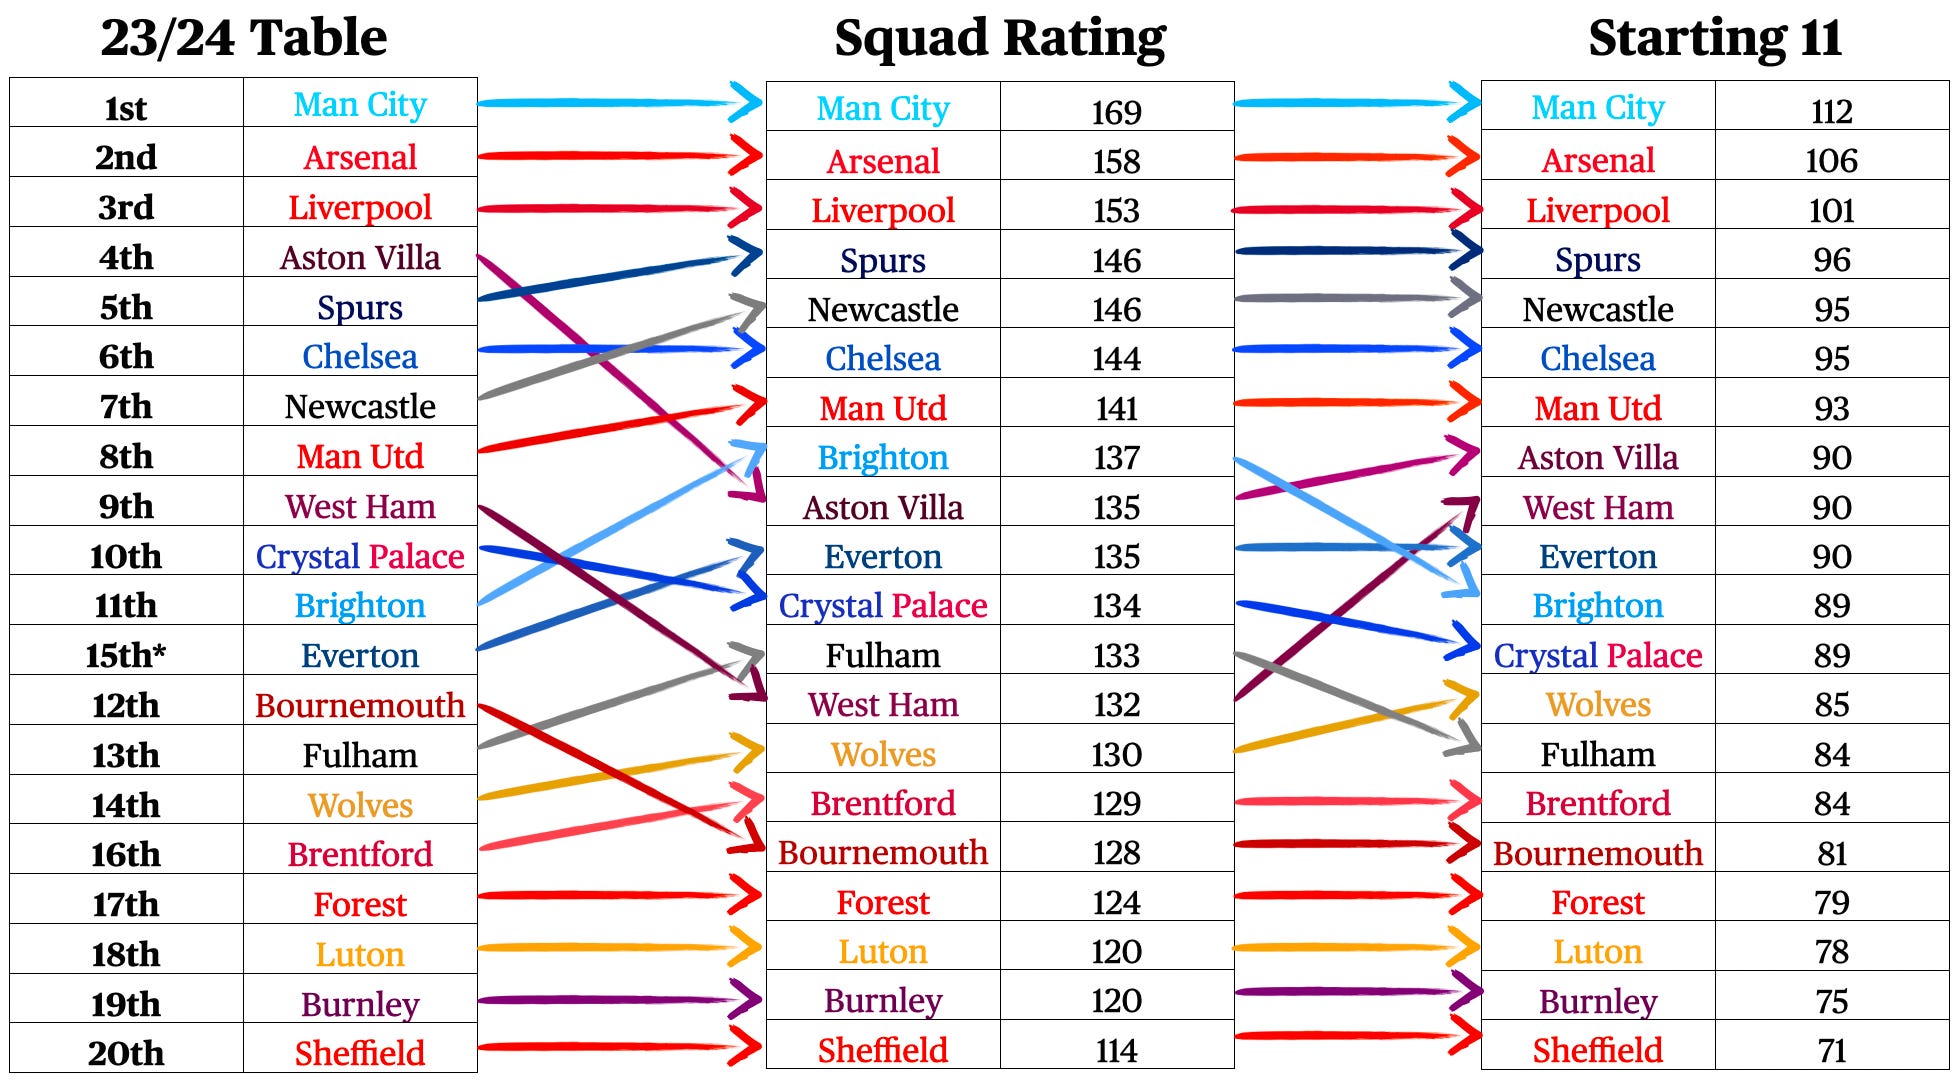
Step 3: Create a Squad Rating Table
Compile each team’s squad rating into a ranking.
Compare with actual table.
Visualise it with a graphic for easier understanding.

Average Rating Against (ARA)
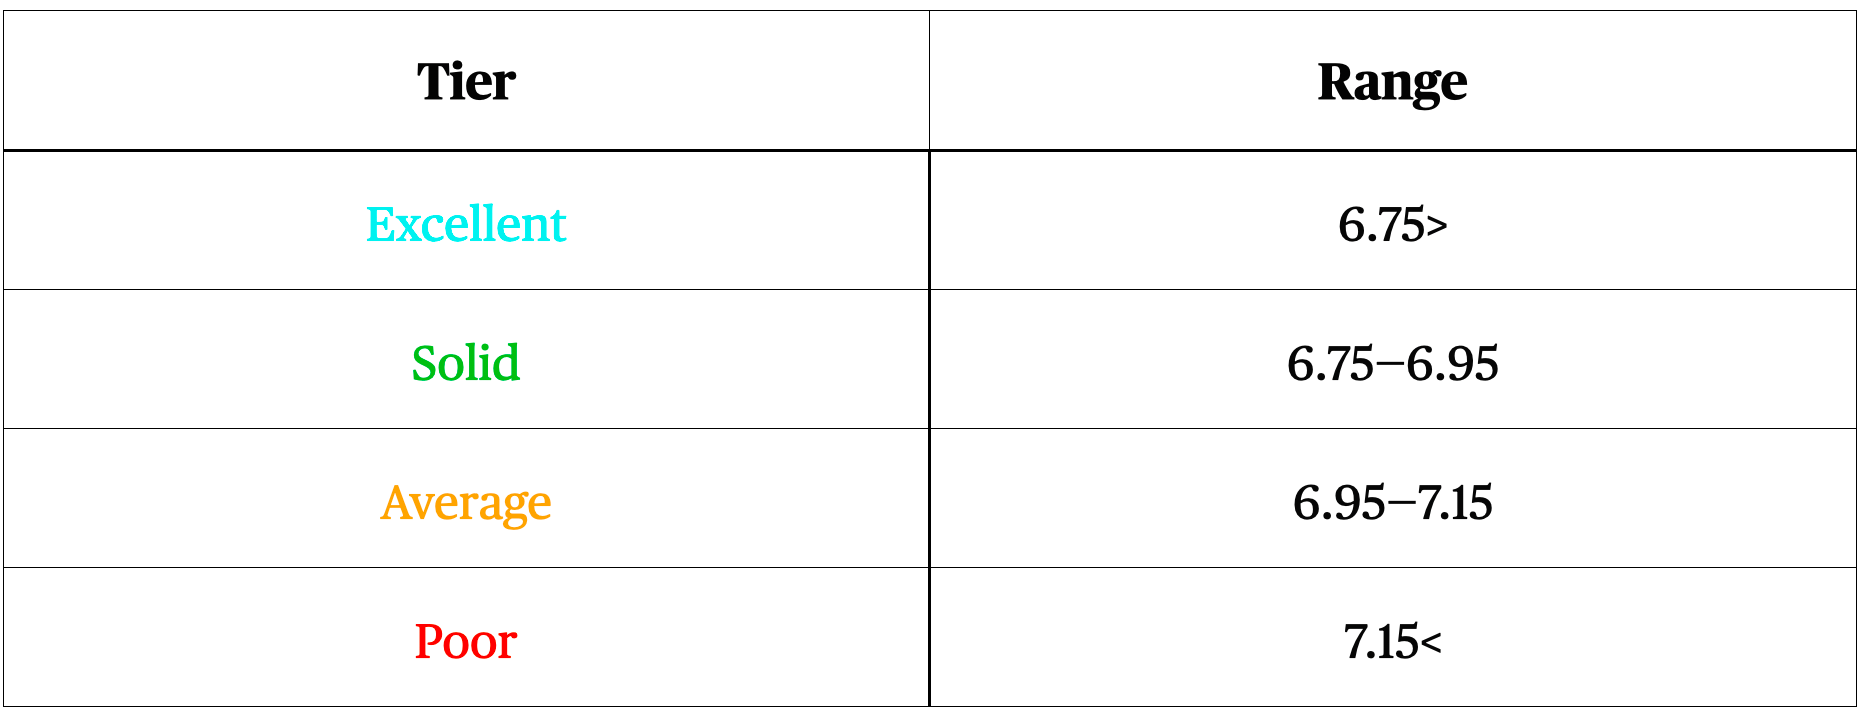
This time there’s another idea I want to introduce to the series. In my original version we account for a team’s performance across the season but not specifically for how teams performed against them. To solve this issue I came up with the idea of an ‘Average Rating Against’ section. This would be a figure that represents the average rating teams conceded to their opposition.
Here’s how it works: I analyzed all 20 teams and each of their fixtures, recording the average rating scored by the opposing side. This average was derived from the individual player ratings of the opposition. After collecting 38 average ratings for each team, I averaged these to get the overall ARA (Average Rating Against) figure. I then plotted this data on a scatter plot to visualize team form throughout the season.
Here’s how that table looked:
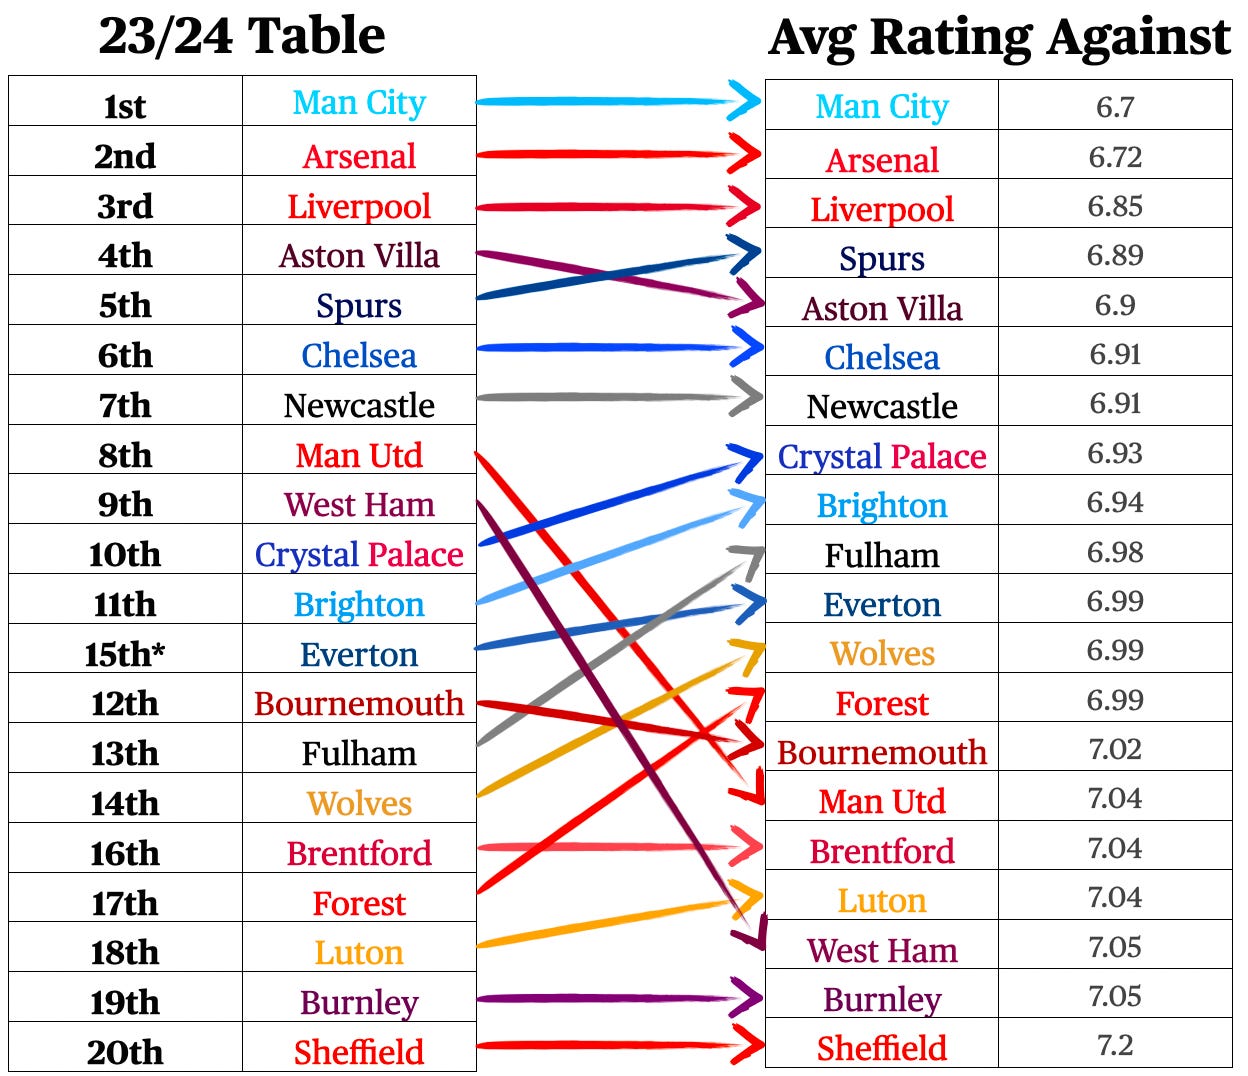
By bringing in this new ARA section we will be able to analyse a team from a form perspective, being able to recognise the phases in which they performed well or poorly. All this does is provide further context through numbers highlighting the algorithm’s ability to reflect real-time performance. With that being said, it’s time to start our analysis of each squad, trying to find reasons for their respective performance.
1st—8th
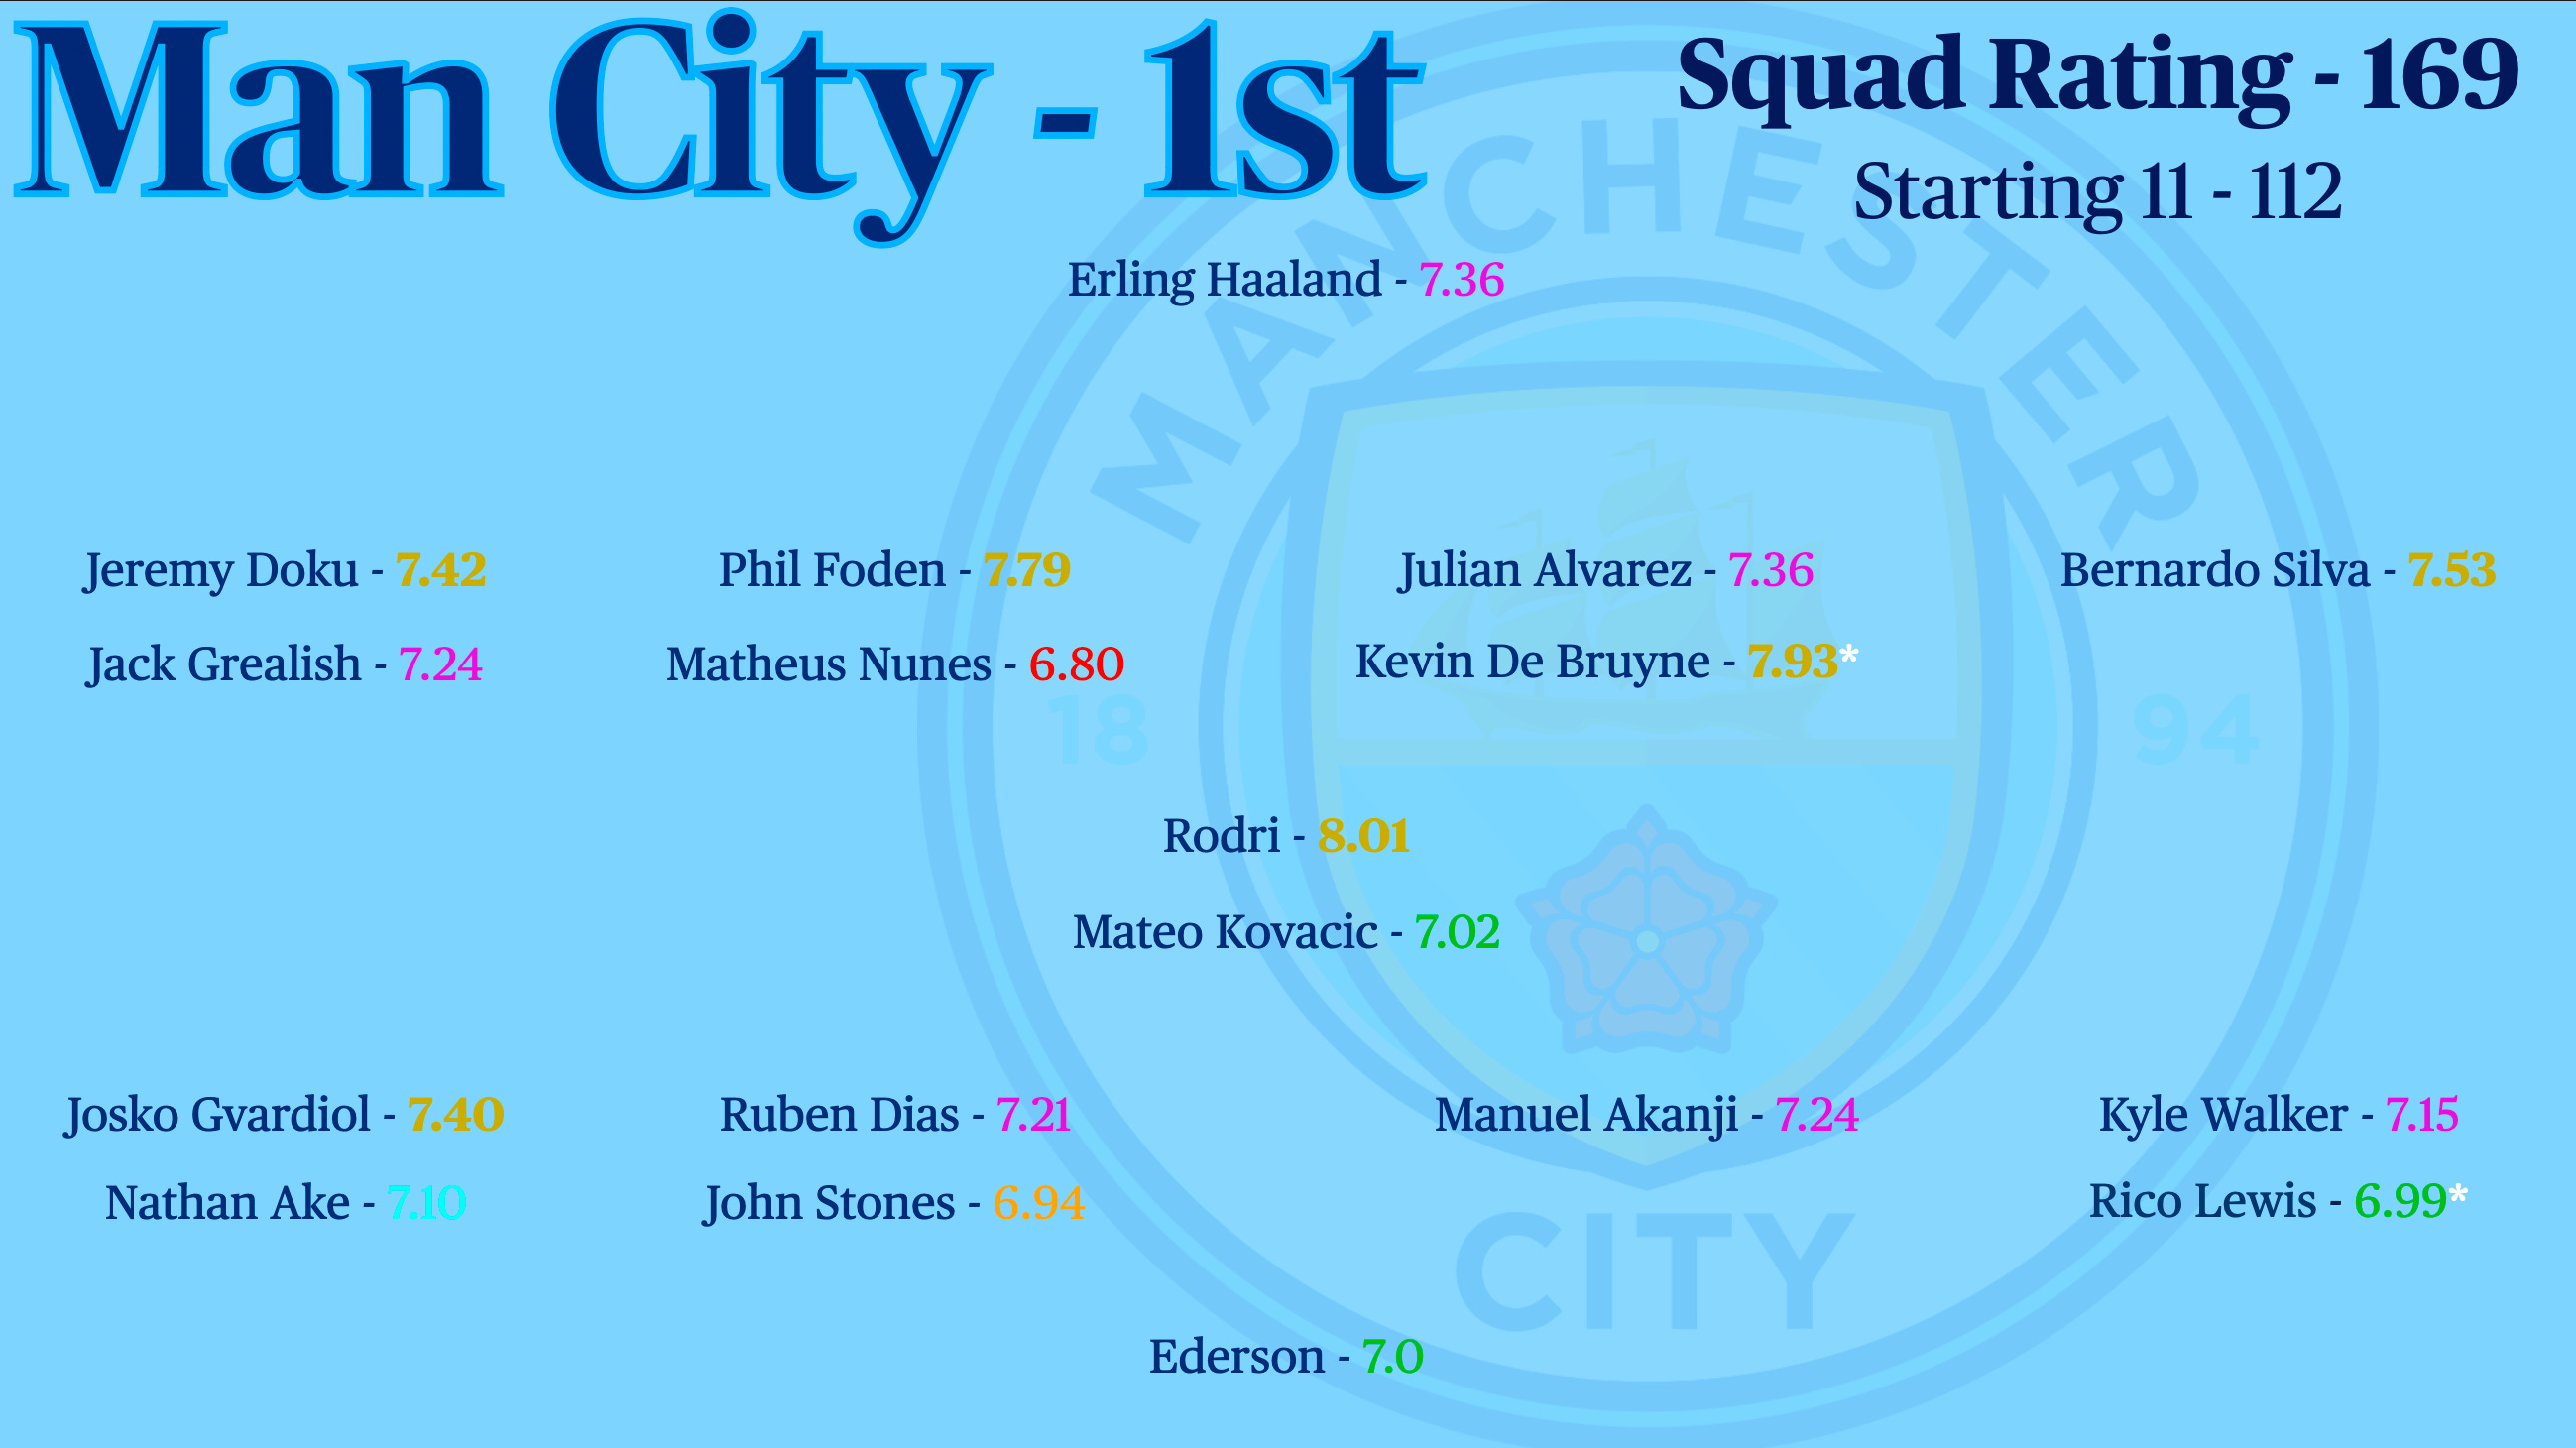
1st Squad Rating (—)
Despite being pushed to the final day by a powerful Arsenal side, Manchester City got another one over the line to continue their dominance over English football. In terms of their rating table performance, there can be no debate who was the best performing side in the league. We have a team here with virtually zero weaknesses, elite in every aspect of the pitch, boasting six players ranking in 1st Class. Rodri and Foden ranked as 1 and 2 in terms of the best players in the league with De Bruyne more than likely being up there had he met the appearances quota. What more is there to say?
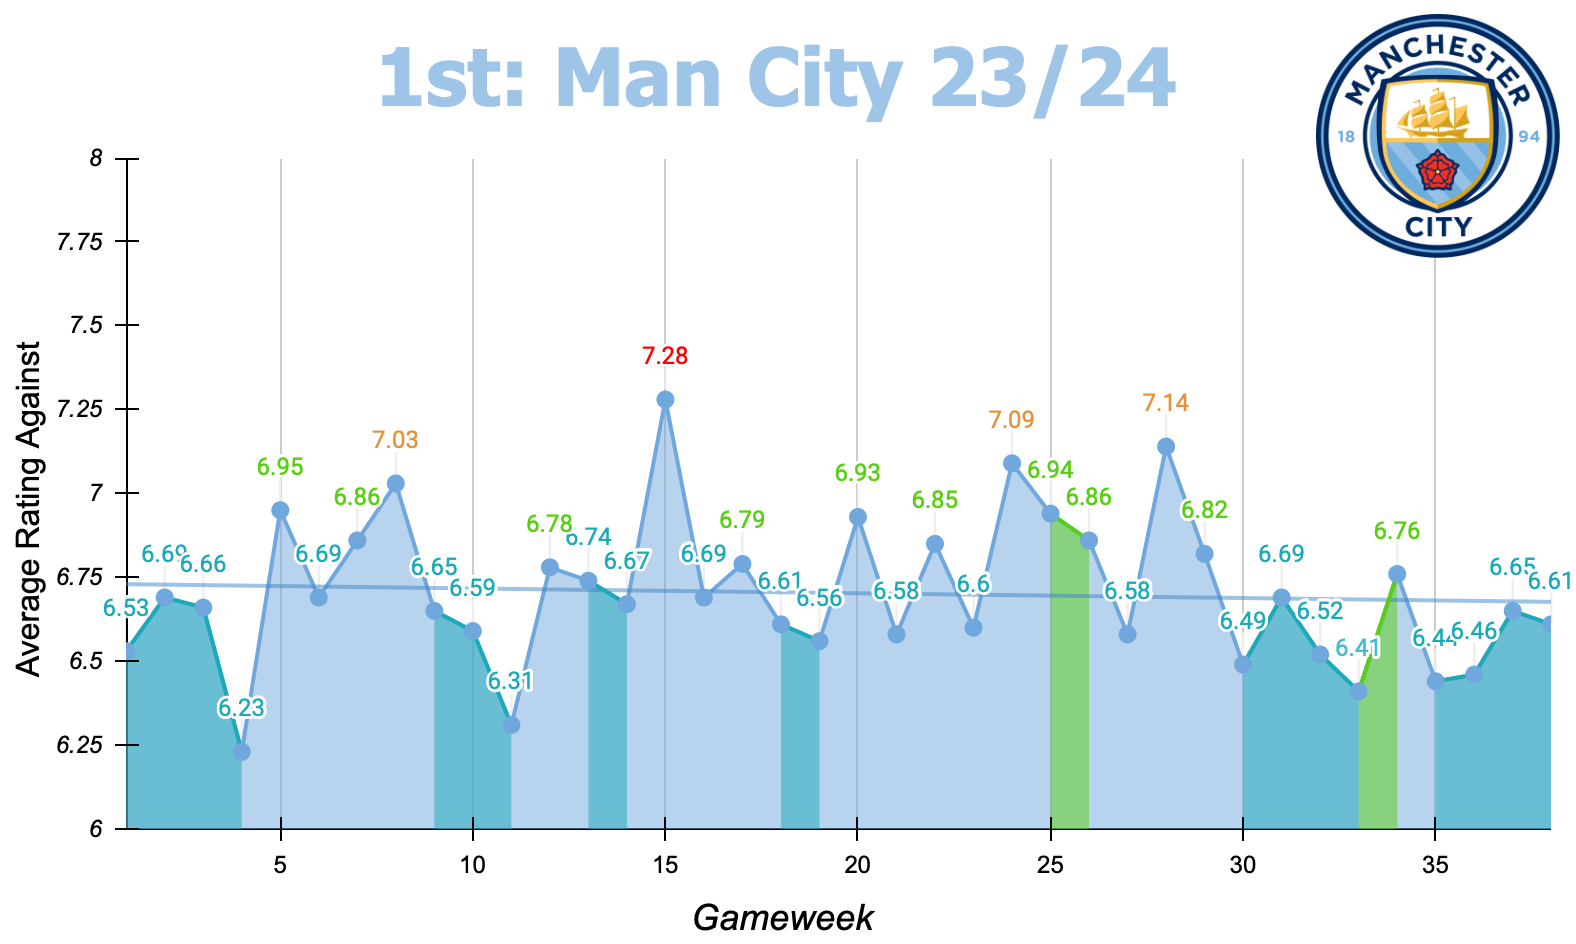
1st ARA (—)
Unsurprisingly City also topped the table for their ARA, the simple fact is they’re pretty much unstoppable when it’s the business end of the season. If you look at the graph we see some slight peaks between game week 20-30, where performance may have slightly dropped off. As soon as week 30 hits, the switch is flipped and they went to a new level which secured them the title. It’s this relentless consistency that has made them 4-time champions and will mean anyone who wants to take their crown will have to be nigh on perfect for 38 games.
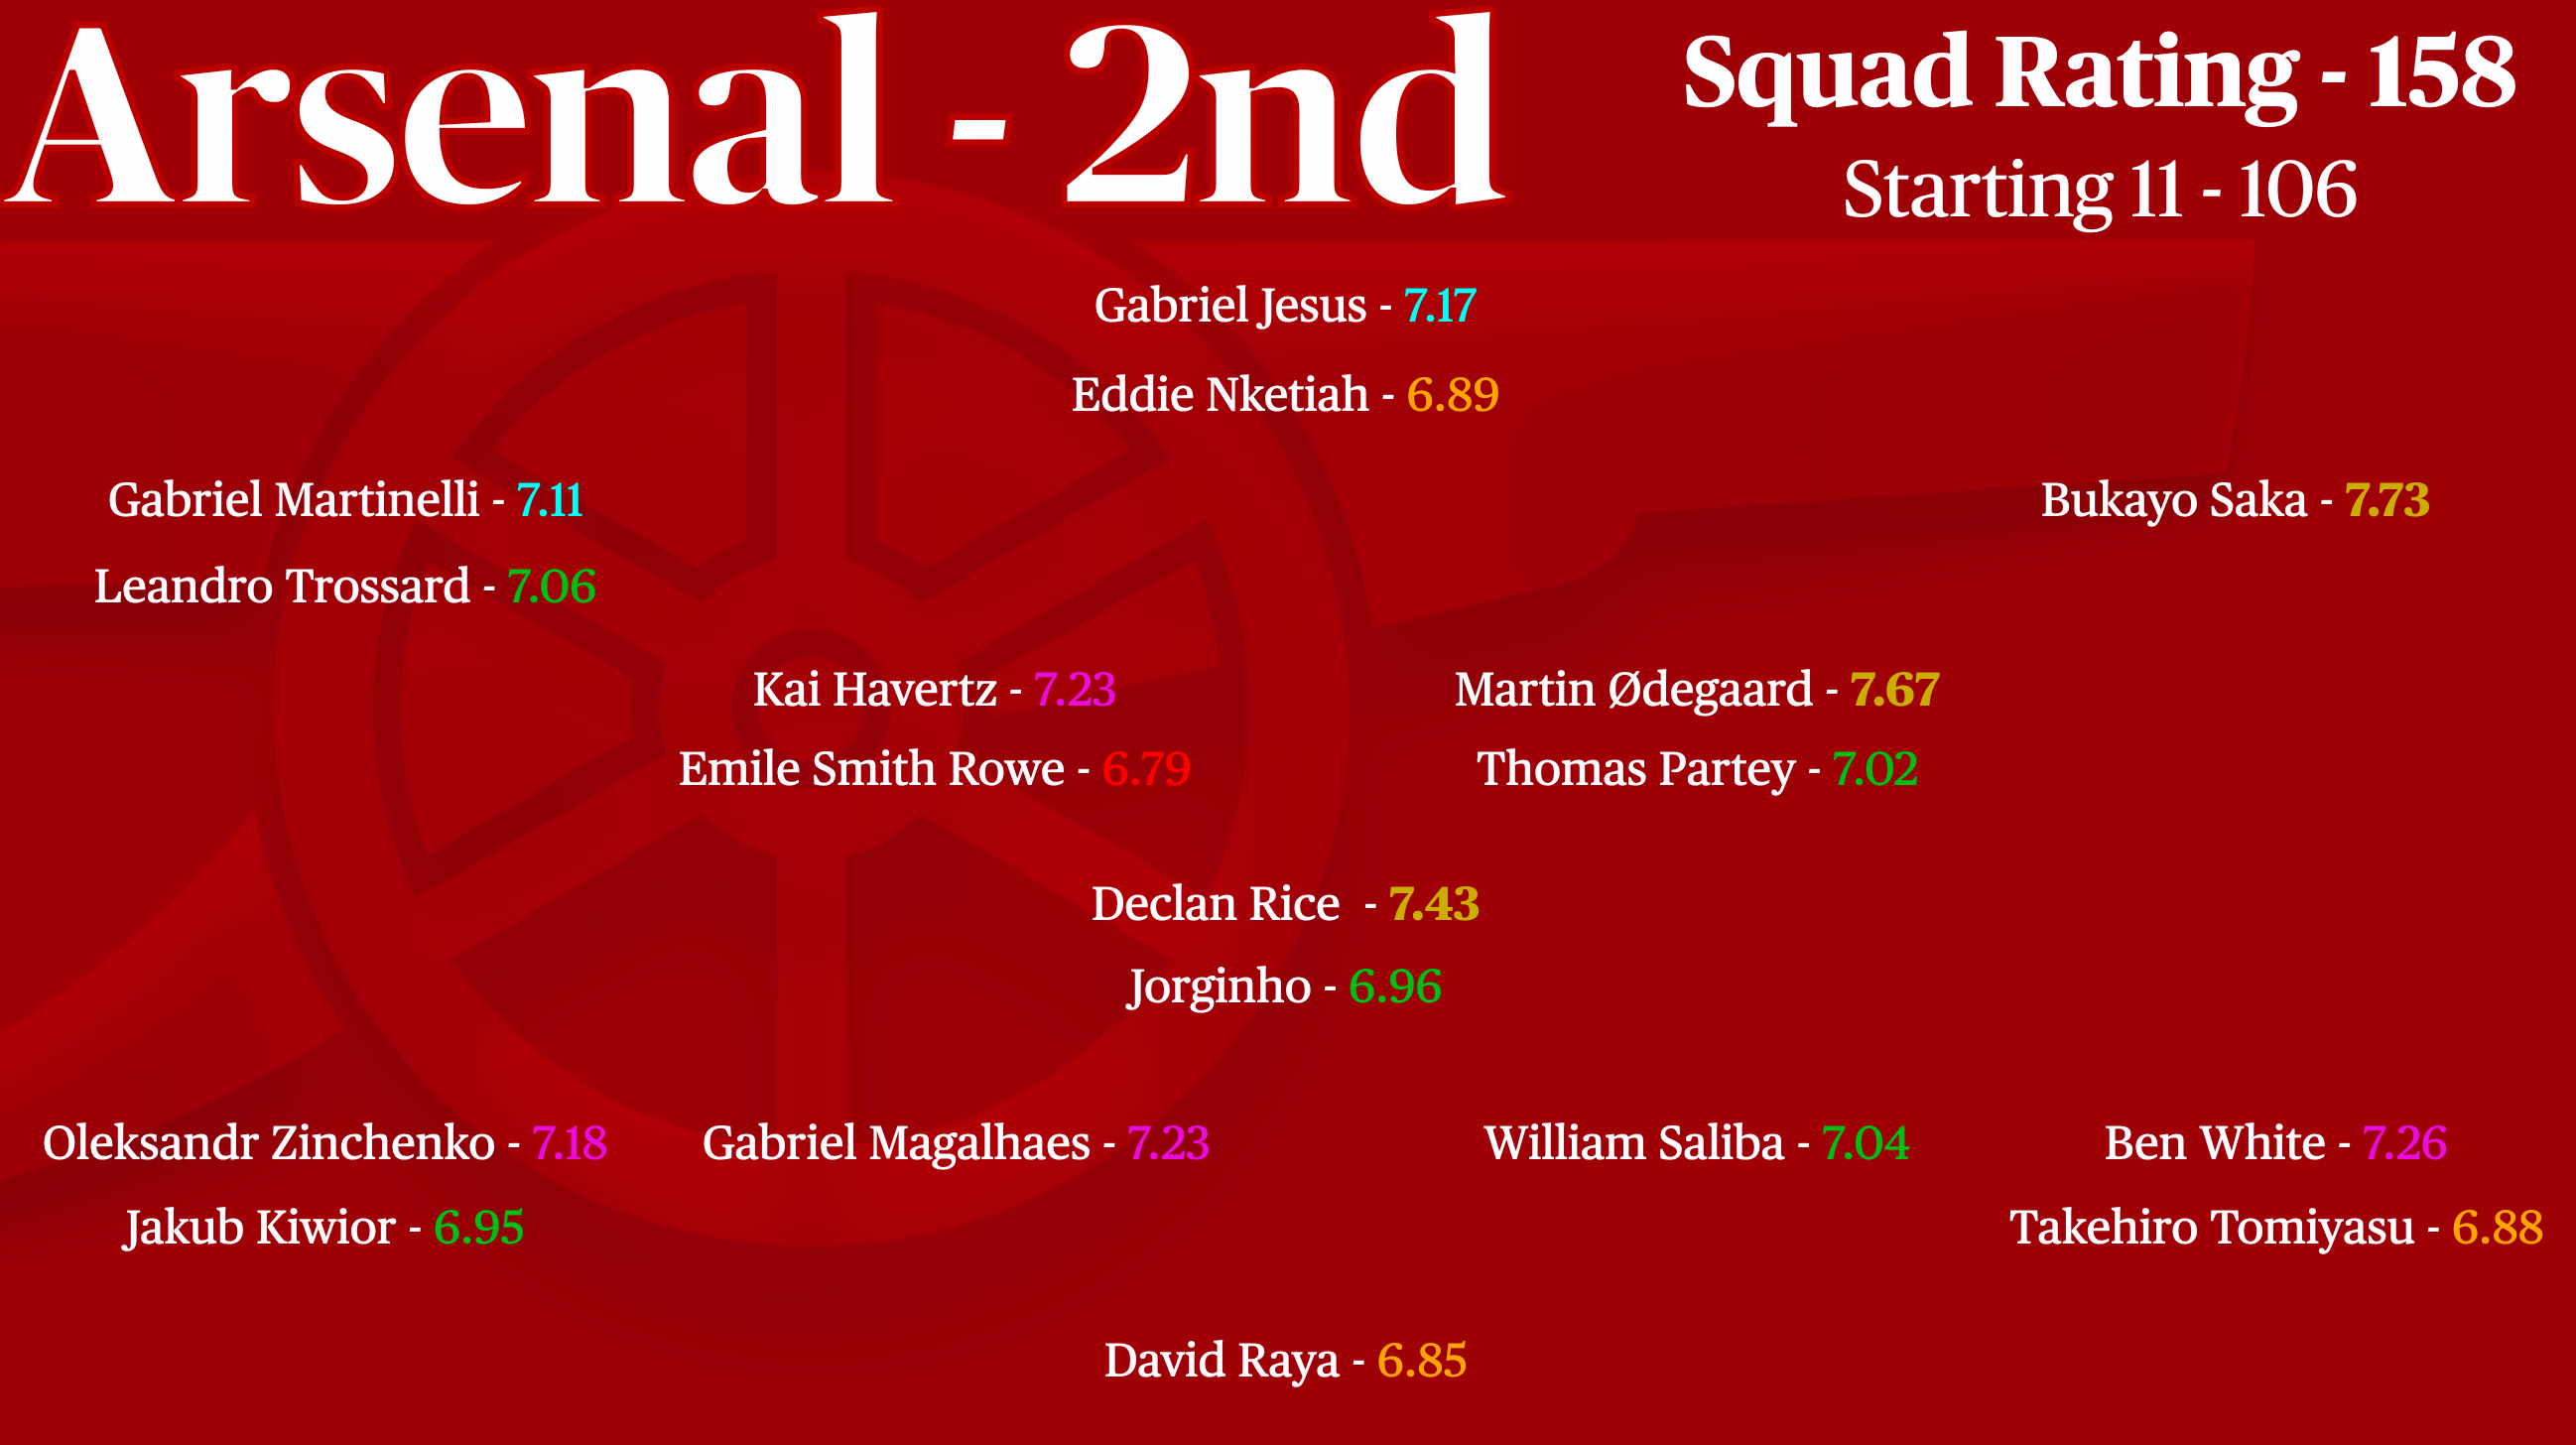
2nd Squad Rating (—)
Falling short of the Premier League title for a second year, Arsenal are inching closer to glory. This season saw big improvements, with players stepping up and key signings delivering. Statistically the league's best defense, Gabriel and White made huge strides, while £100 million signing Rice seamlessly integrated, elevating Ødegaard’s game. Saka emerged as a league superstar on the flanks, though Martinelli’s progress stalled. Havertz shined at striker in the season’s final stretch. But a lack of depth—especially in midfield and defense—proved to be their undoing. Unable to match the quality seen over at the Etihad.
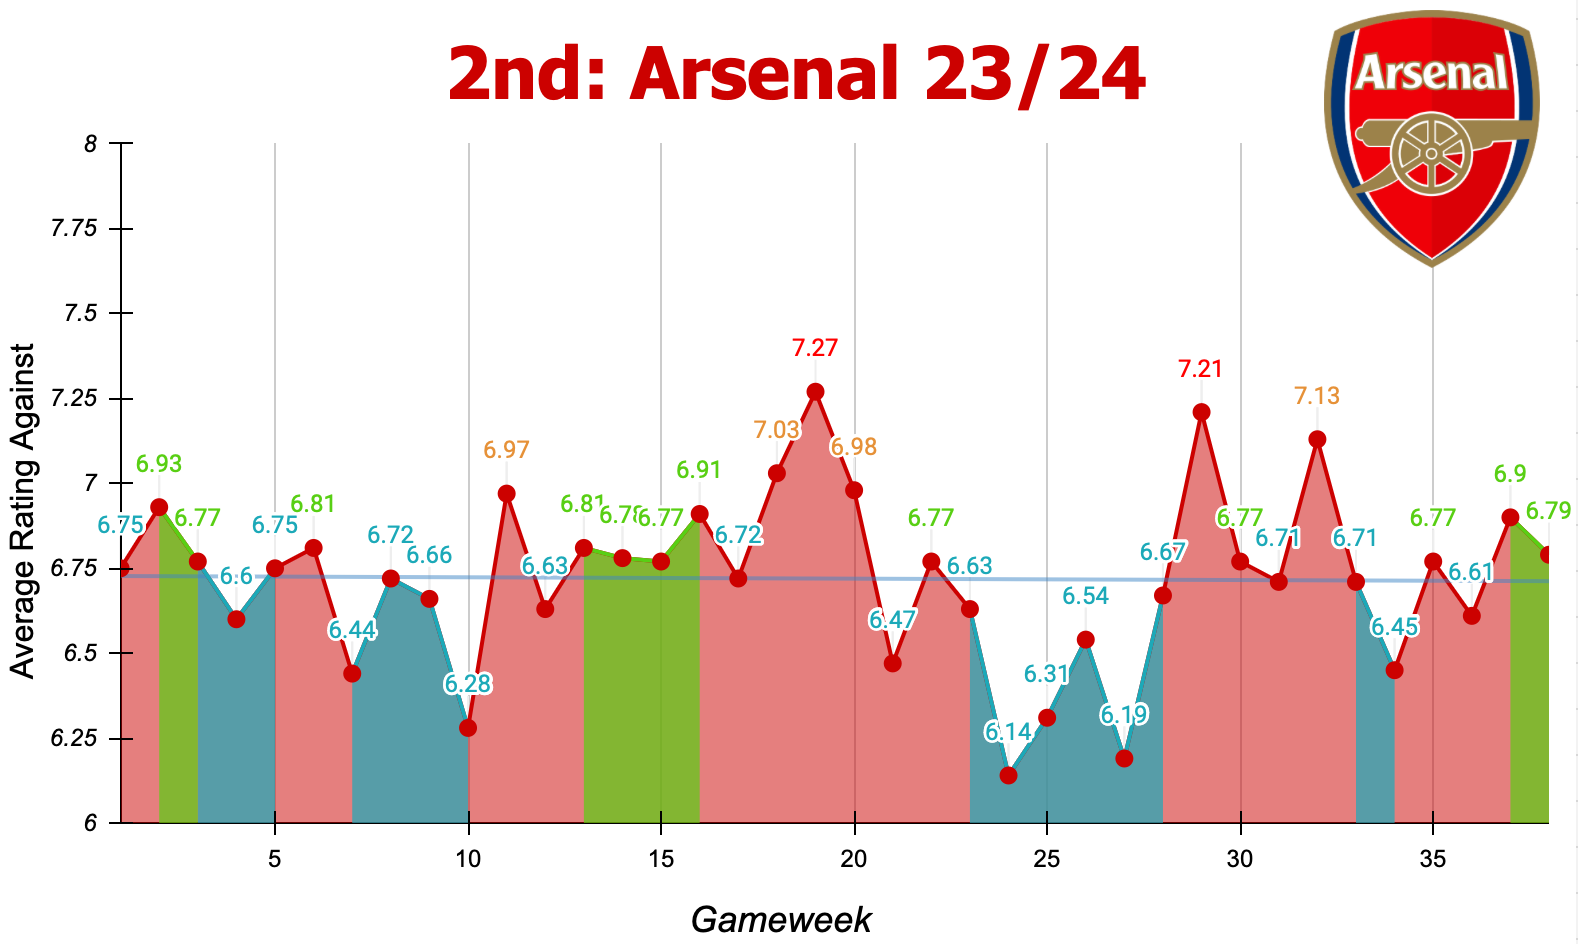
2nd ARA (—)
In terms of their ARA, Arsenal actually came way closer in the tables than they did with the Squad Rating. For the majority of the games they performed to remarkably high levels. This was especially the case in the period from gameweek 20-30, going on a complete tear and not allowing other teams any joy. What we mostly see is costly blips and a 3 game dip in performance halfway into the season. The reason this is important to note is because City on the other hand, never really dropped off for more than one game at a time. That’s what it takes.
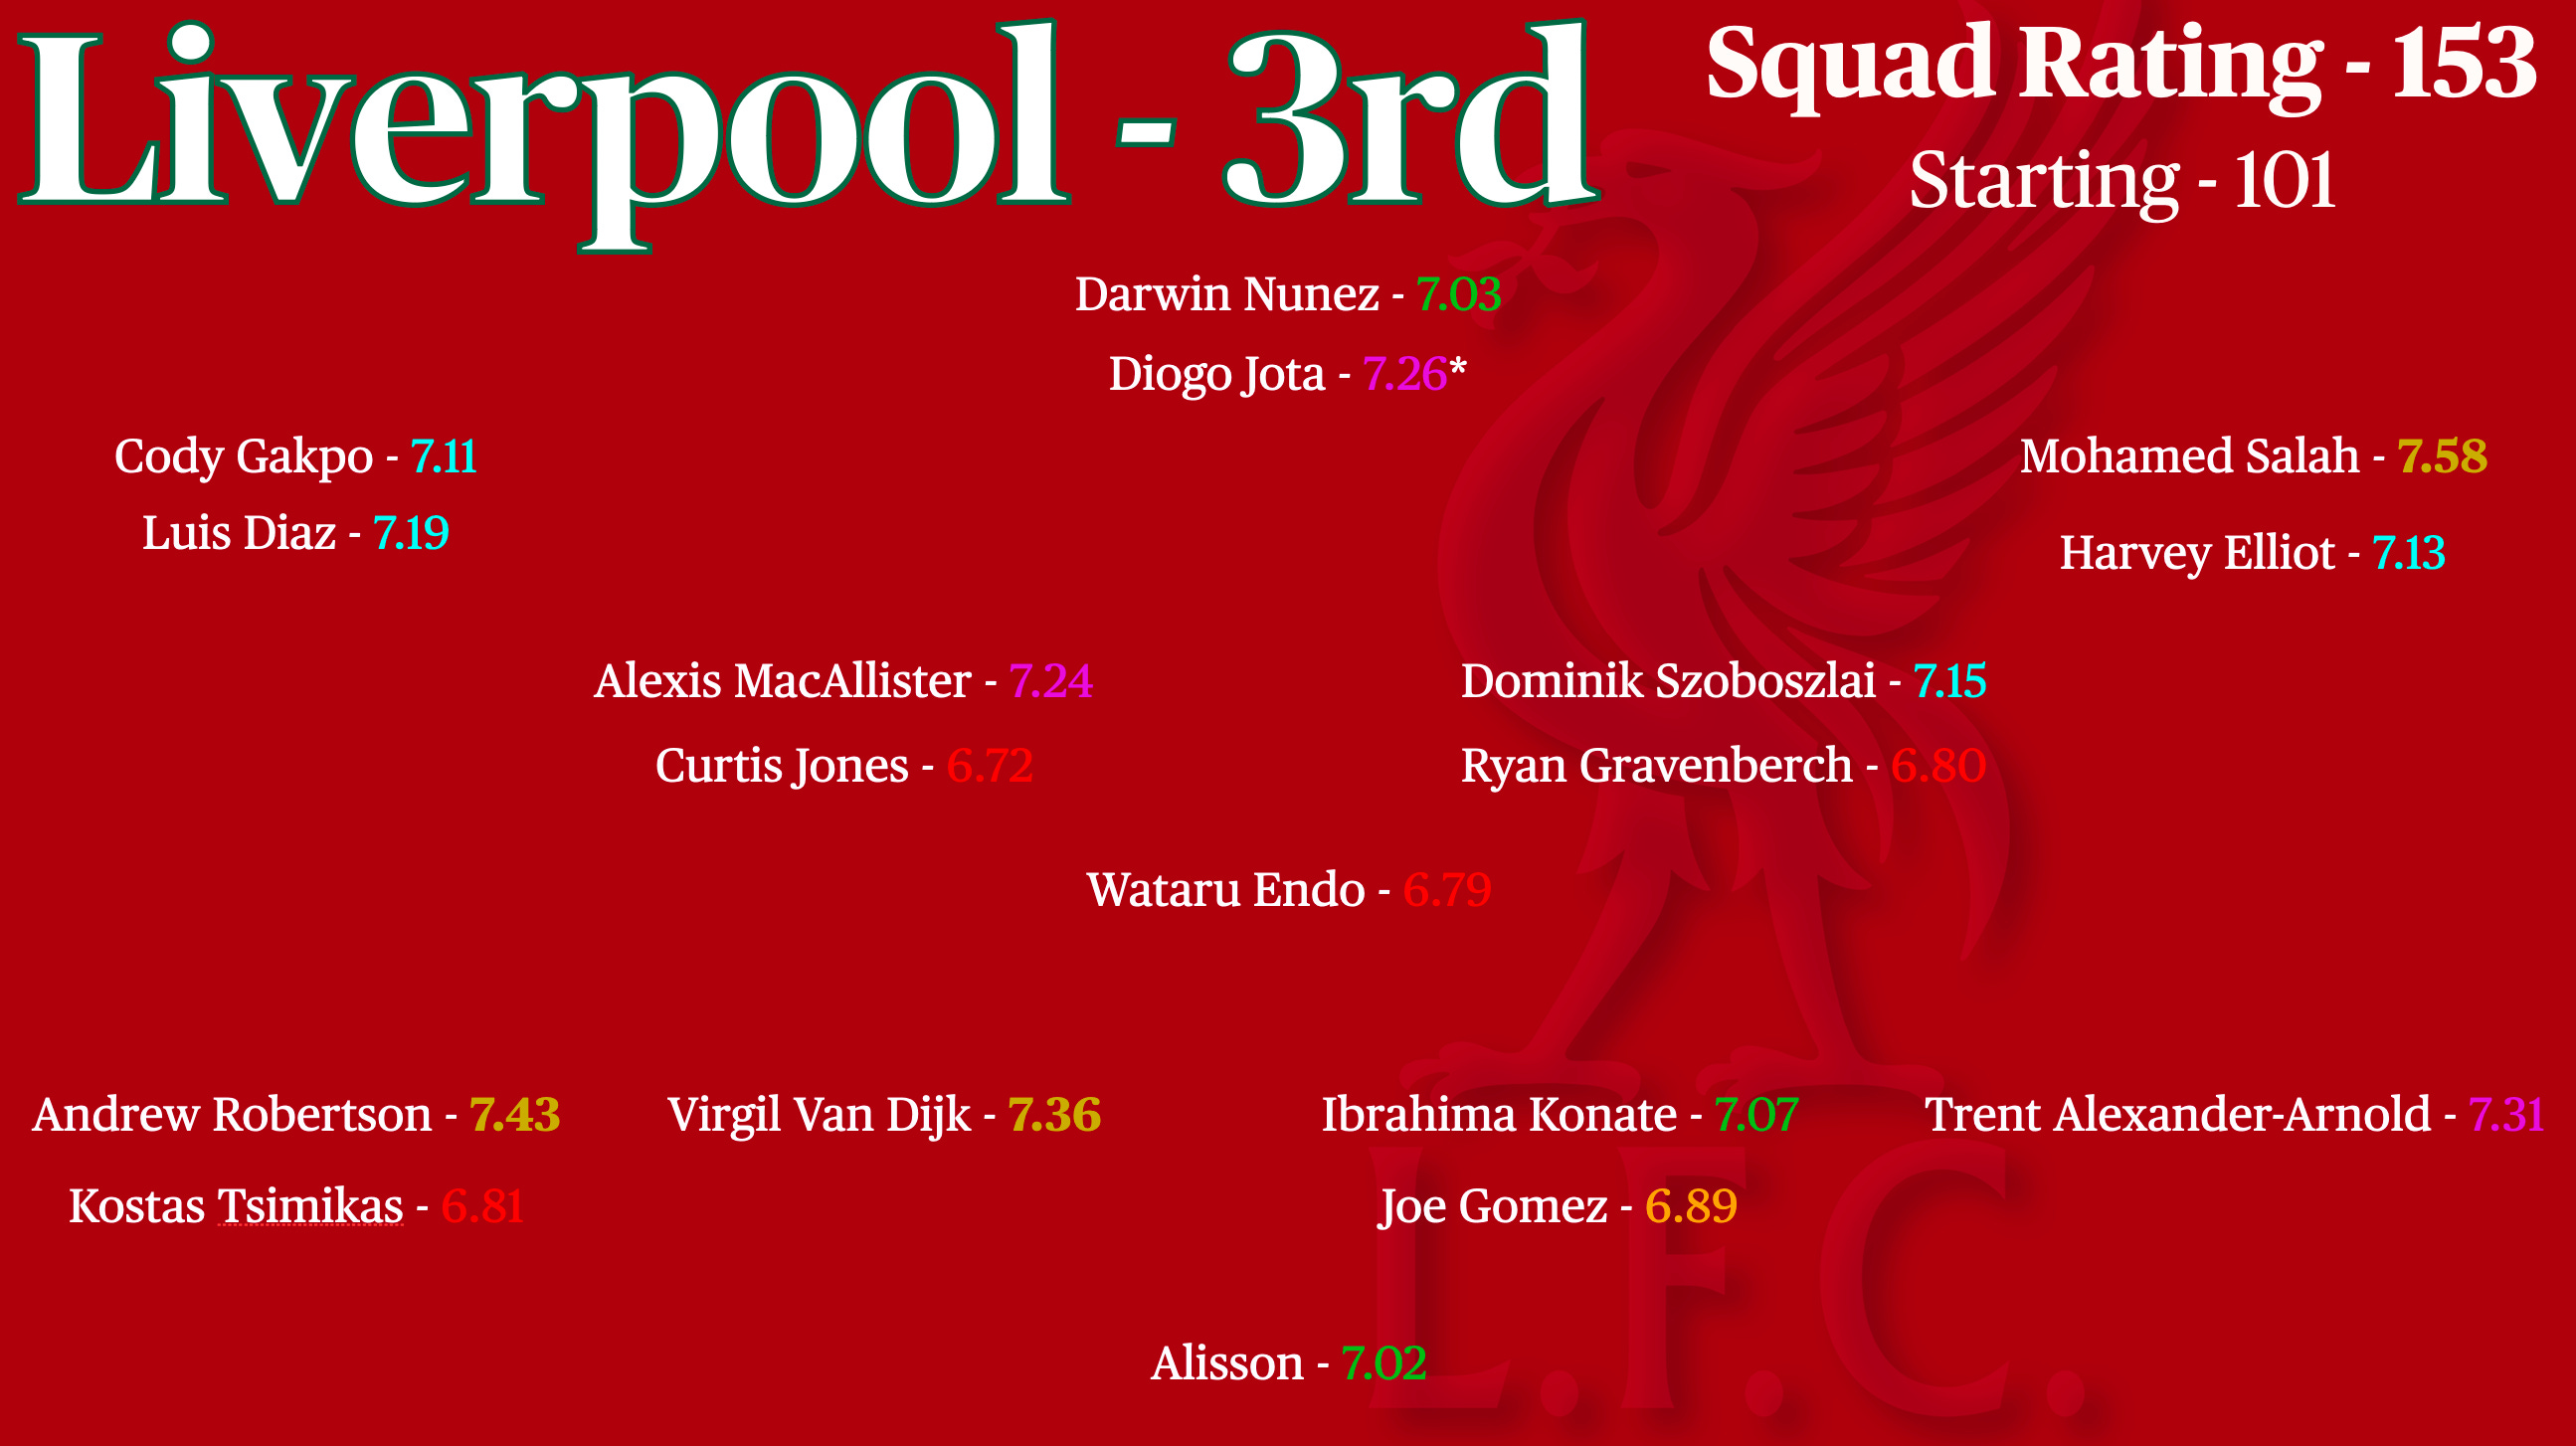
3rd Squad Rating (—)
For much of the 23/24 season, it looked like Jürgen Klopp’s fairytale—a Premier League title and a fitting send-off—could become reality. But as hopes rose, so did the challenges, and Liverpool’s season ended on a more subdued note. They stayed competitive until right near the very end, with Robertson, Van Dijk, and Trent exceptional at the back. Though a fan favorite, Endo struggled in midfield, while new arrivals MacAllister and Szoboszlai adapted well. Up front, Salah was the standout, with Nunez and others contributing but not quite matching the level needed to topple the champions in sky blue.
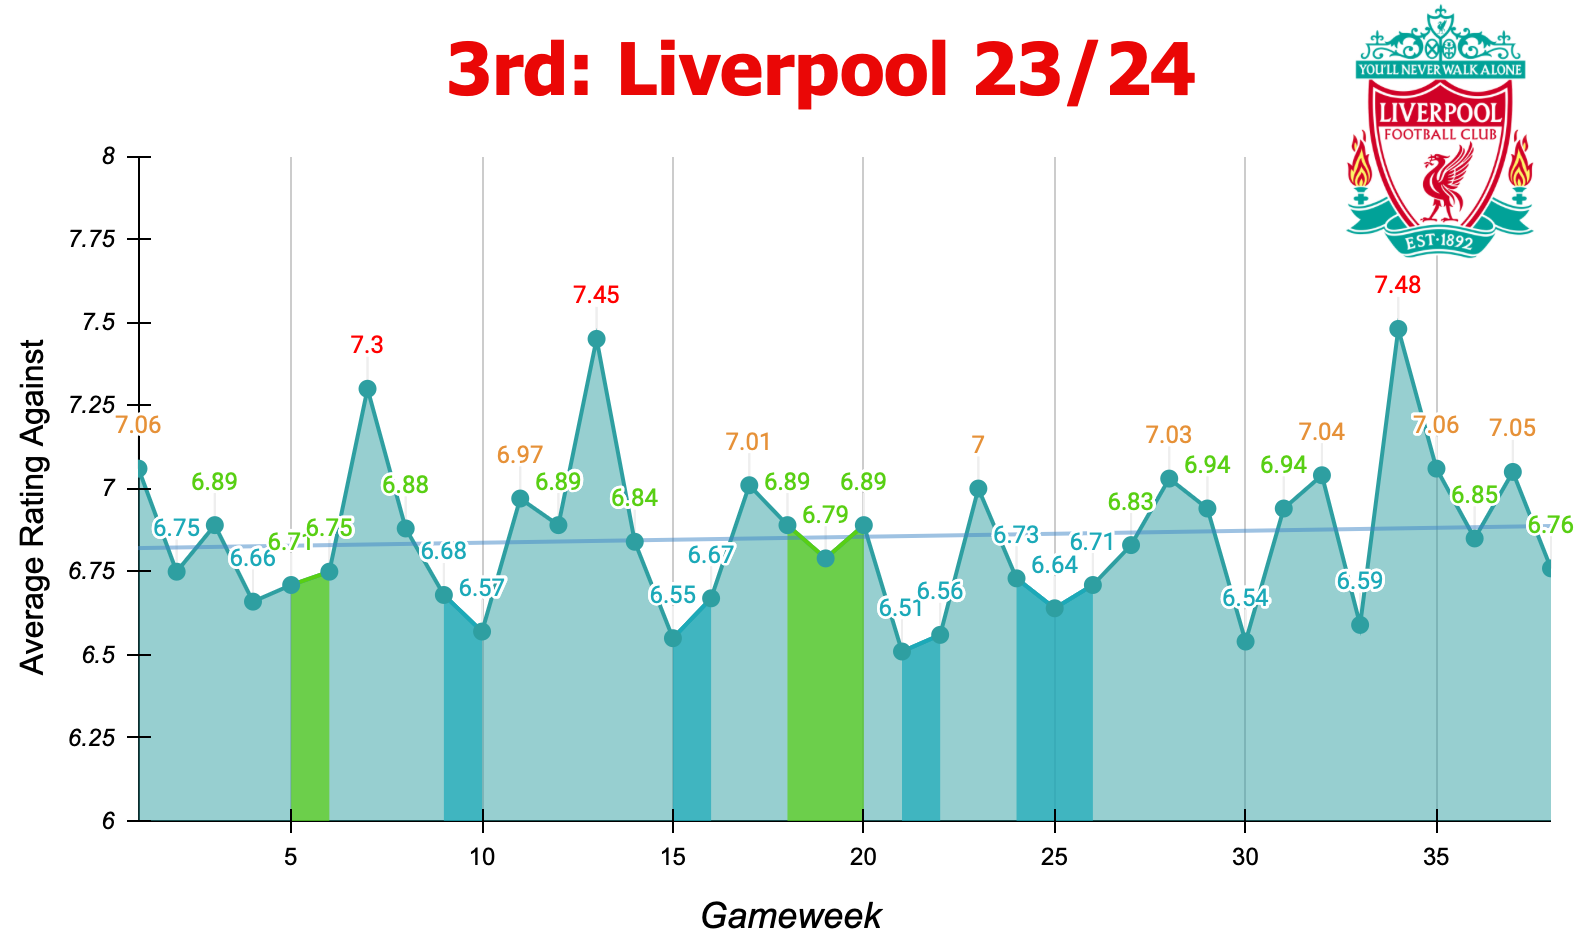
3rd ARA (—)
With Liverpool there’s a pretty straightforward narrative and that plays out well a truly in our ARA graph too. For the first 30 games of the season they kept pace with City and Arsenal, performing to a similar exceptional level with perhaps maybe a few more blips than the others. Their form really picked up midway into the season only to tail off towards the back end. The ratings they were conceding wouldn’t be so bad if they weren’t a side challenging for the title. But when the competition is as good as perfect, you can’t do anything other than match that level. A worthy 3rd place.
9th Squad Rating (-5)
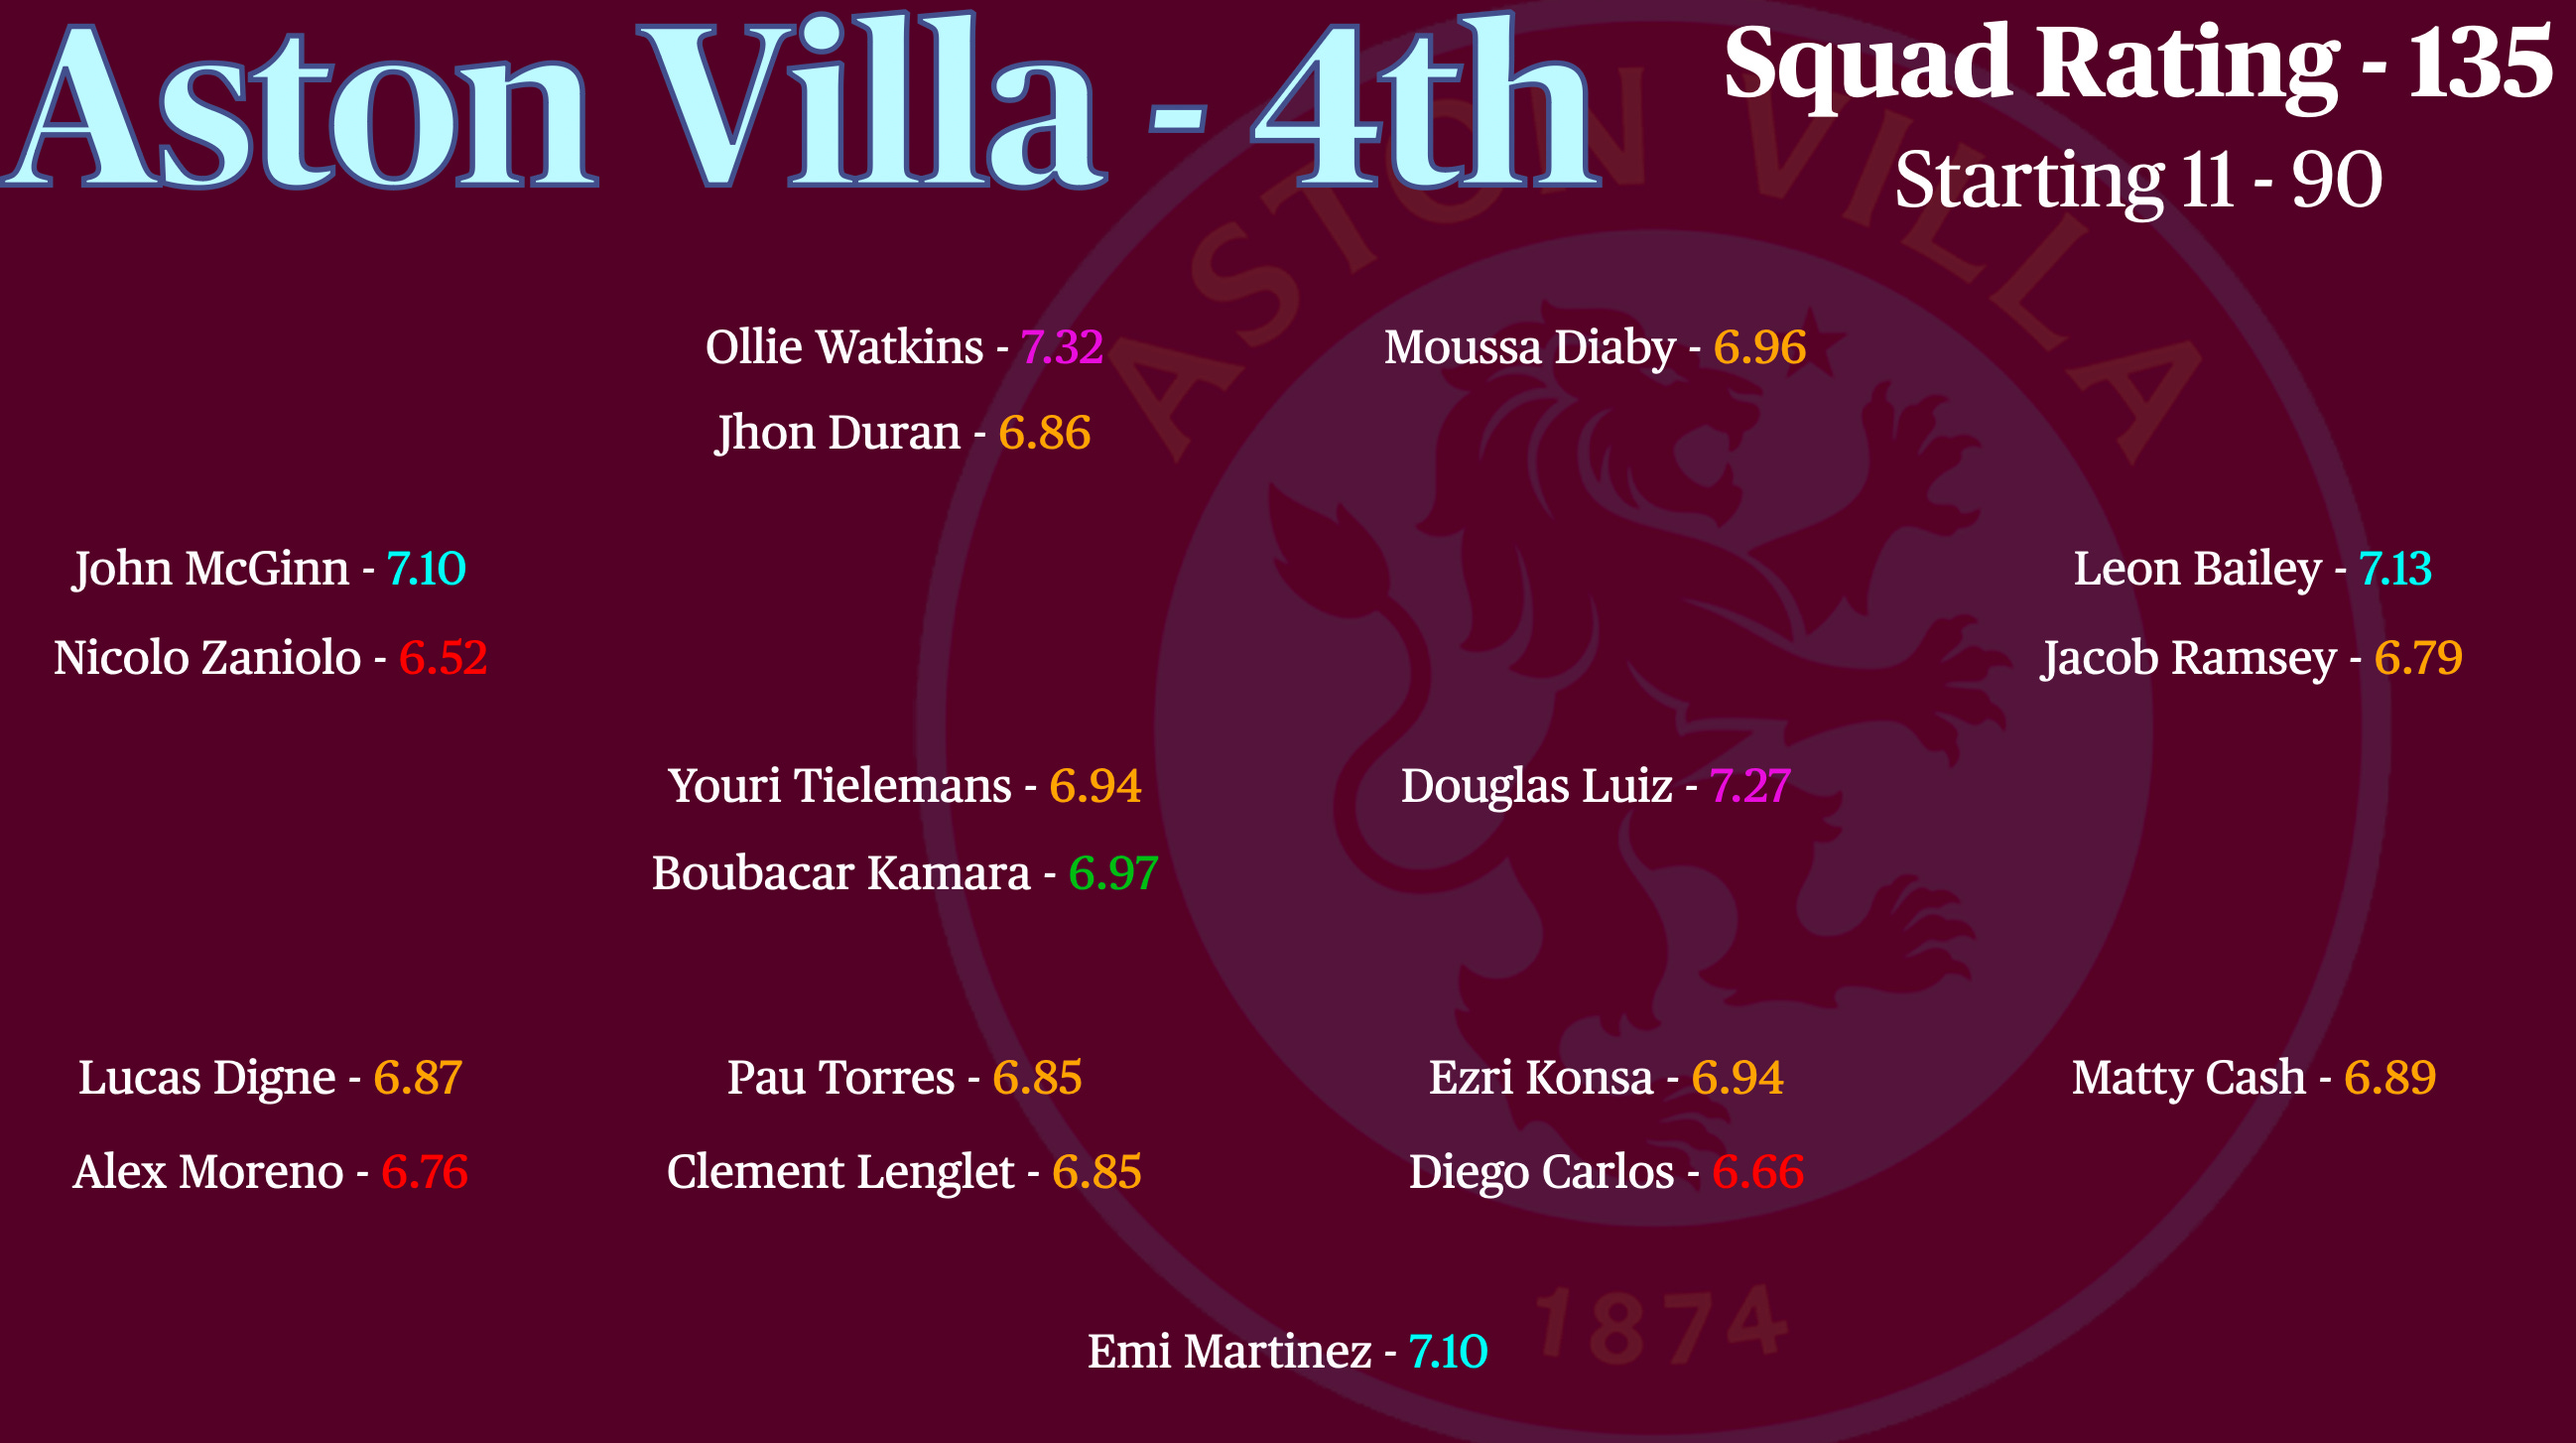
The first real outlier here is Unai Emery’s Aston Villa, back in Europe’s top competition after 40+ years. From a squad rating angle, their success is surprising—they only ranked 9th and 8th in both tables. Defense saw no players above average, highlighting room for improvement. Douglas Luiz was the standout in midfield, while Bailey finally found form on the wing. Watkins shone up front, ranking as the league’s second-best striker. Depth issues across the pitch, though, will need addressing with European games on the horizon.
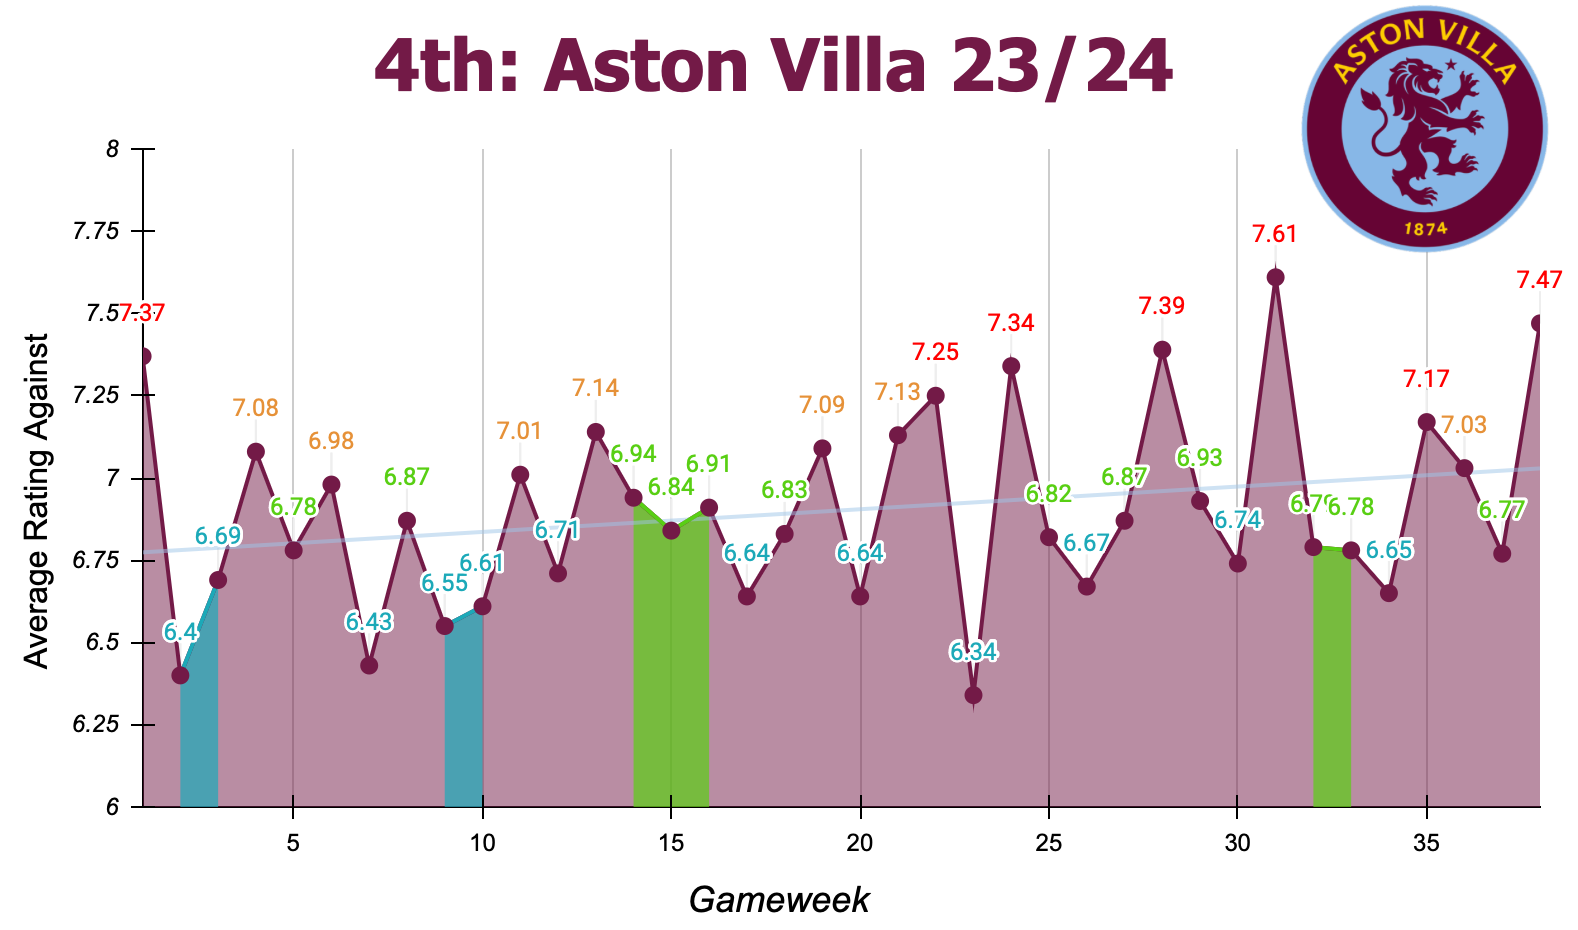
5th ARA (-1)
Their ARA score gives us more context to Aston Villa’s performance. What we see is a team that generally blew hot or cold. They were either excellent or really poor, with no middle ground. Aside from the very first game, Villa’s first half of the season was exceptional. Many of their excellent performances came in this period, whilst all their poor performances came in the second half. Despite the inconsistencies, Villa ranked 5th in the table, a much better performance than their ‘Squad Rating’ suggested. This means their strength lay in limiting other teams and doing just enough to win, rather than delivering a string of huge performances.
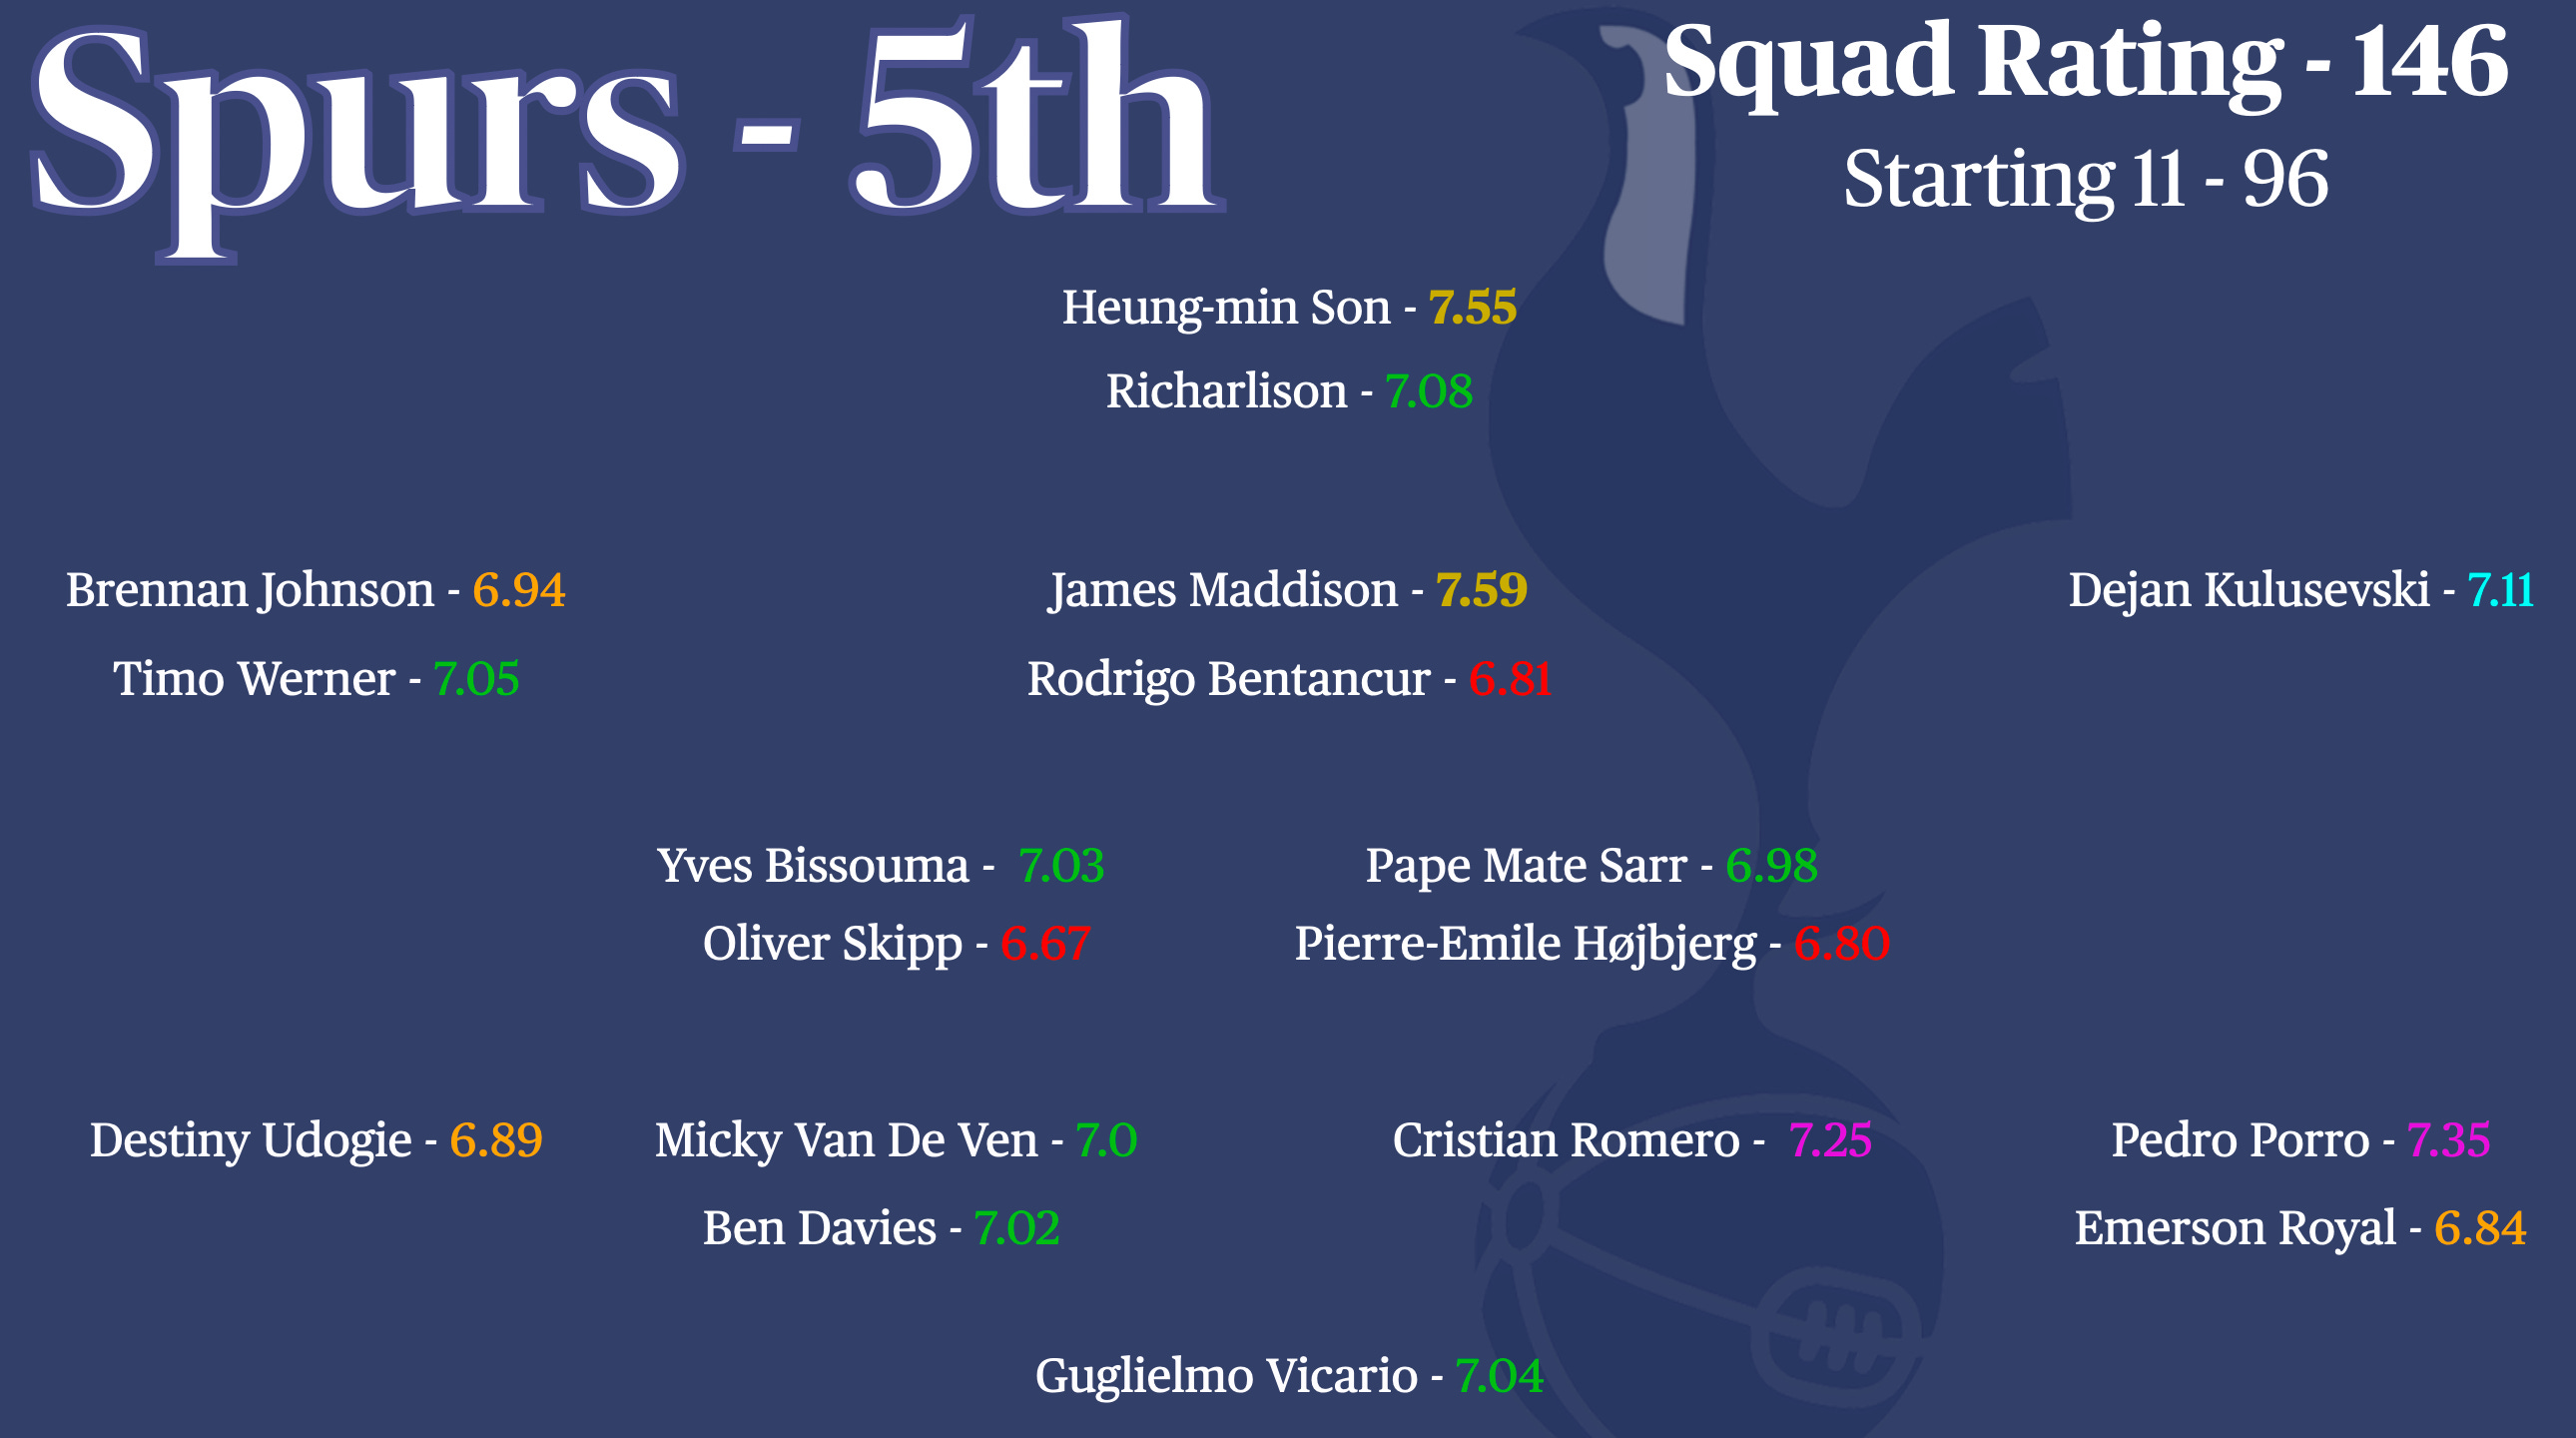
4th Squad Rating (+1)
With a new manager and a young, hungry team, Spurs fans entered the season with hope. While a 5th-place Europa finish would have been welcomed, an impressive start had them dreaming a little bigger. According to the tables, Spurs are where they belong, actually ranking a spot higher for both. The squad showed quality throughout: Son and Maddison delivered superb seasons, while Romero and Porro solidified the defense. However, midfield depth and quality were thin, with only two players ranking as solid of the 4. A few upgrades in key positions, and this could be a team capable of pushing on.
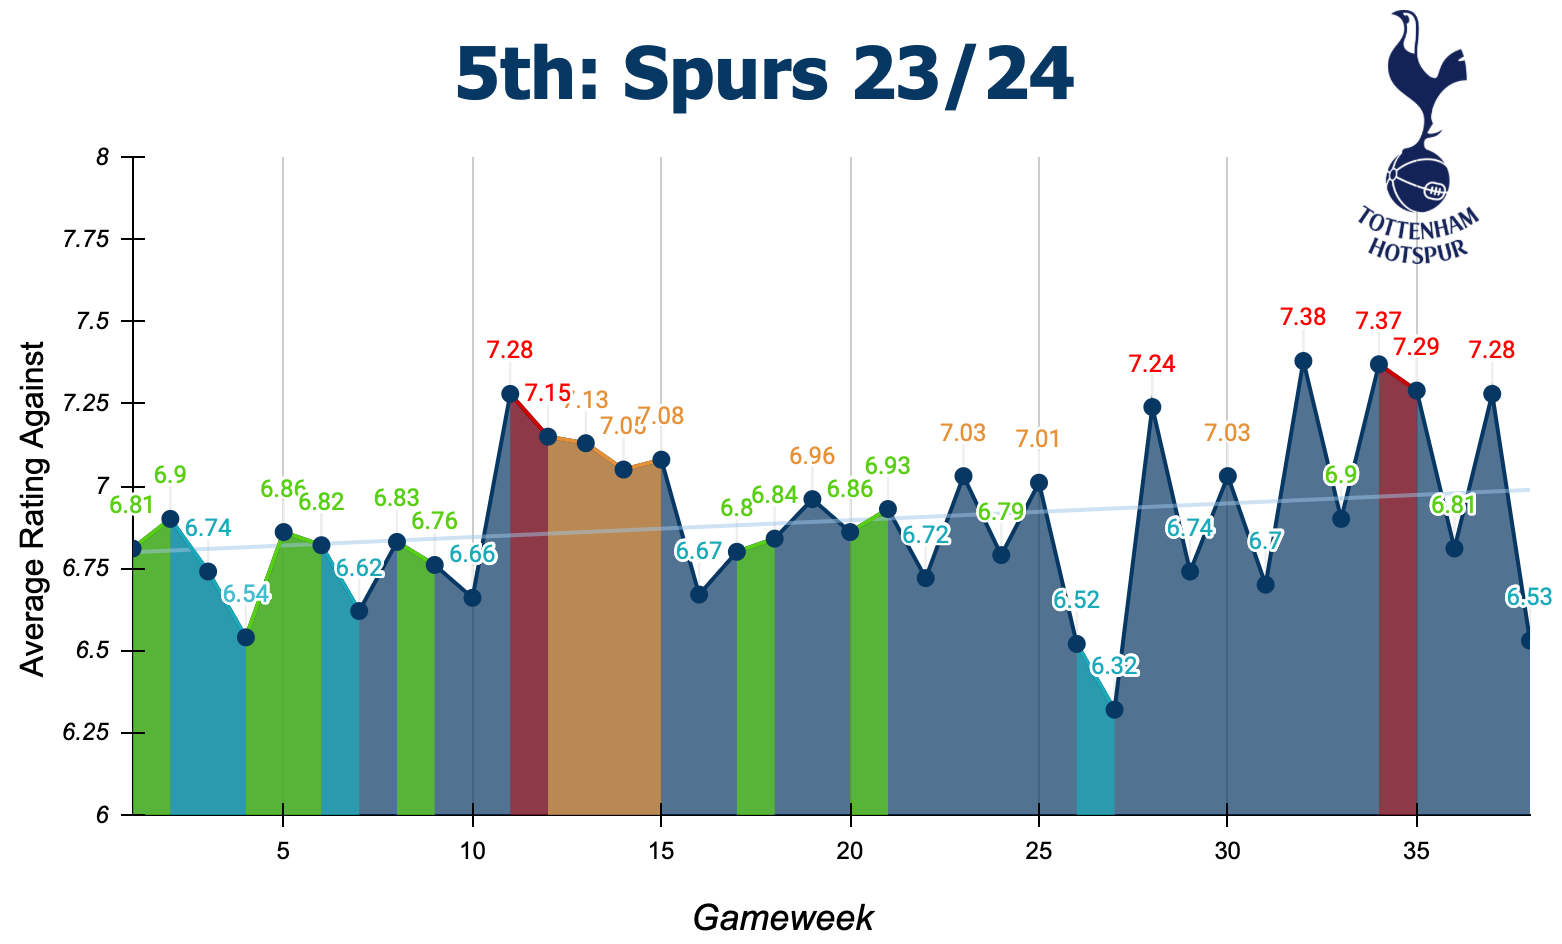
4th ARA (+1)
The graph captures their season almost immediately. In the first 10 games, they looked like title challengers, but a sharp drop in form followed. They recovered and went on another strong run, only to slip again toward season’s end, ultimately missing out on a Champions League spot. This is an inexperienced team full of potential, yet struggling for 38-game consistency. Relying on hot streaks won’t cut it when the slumps are so pronounced. Learning to stay steady will be key.
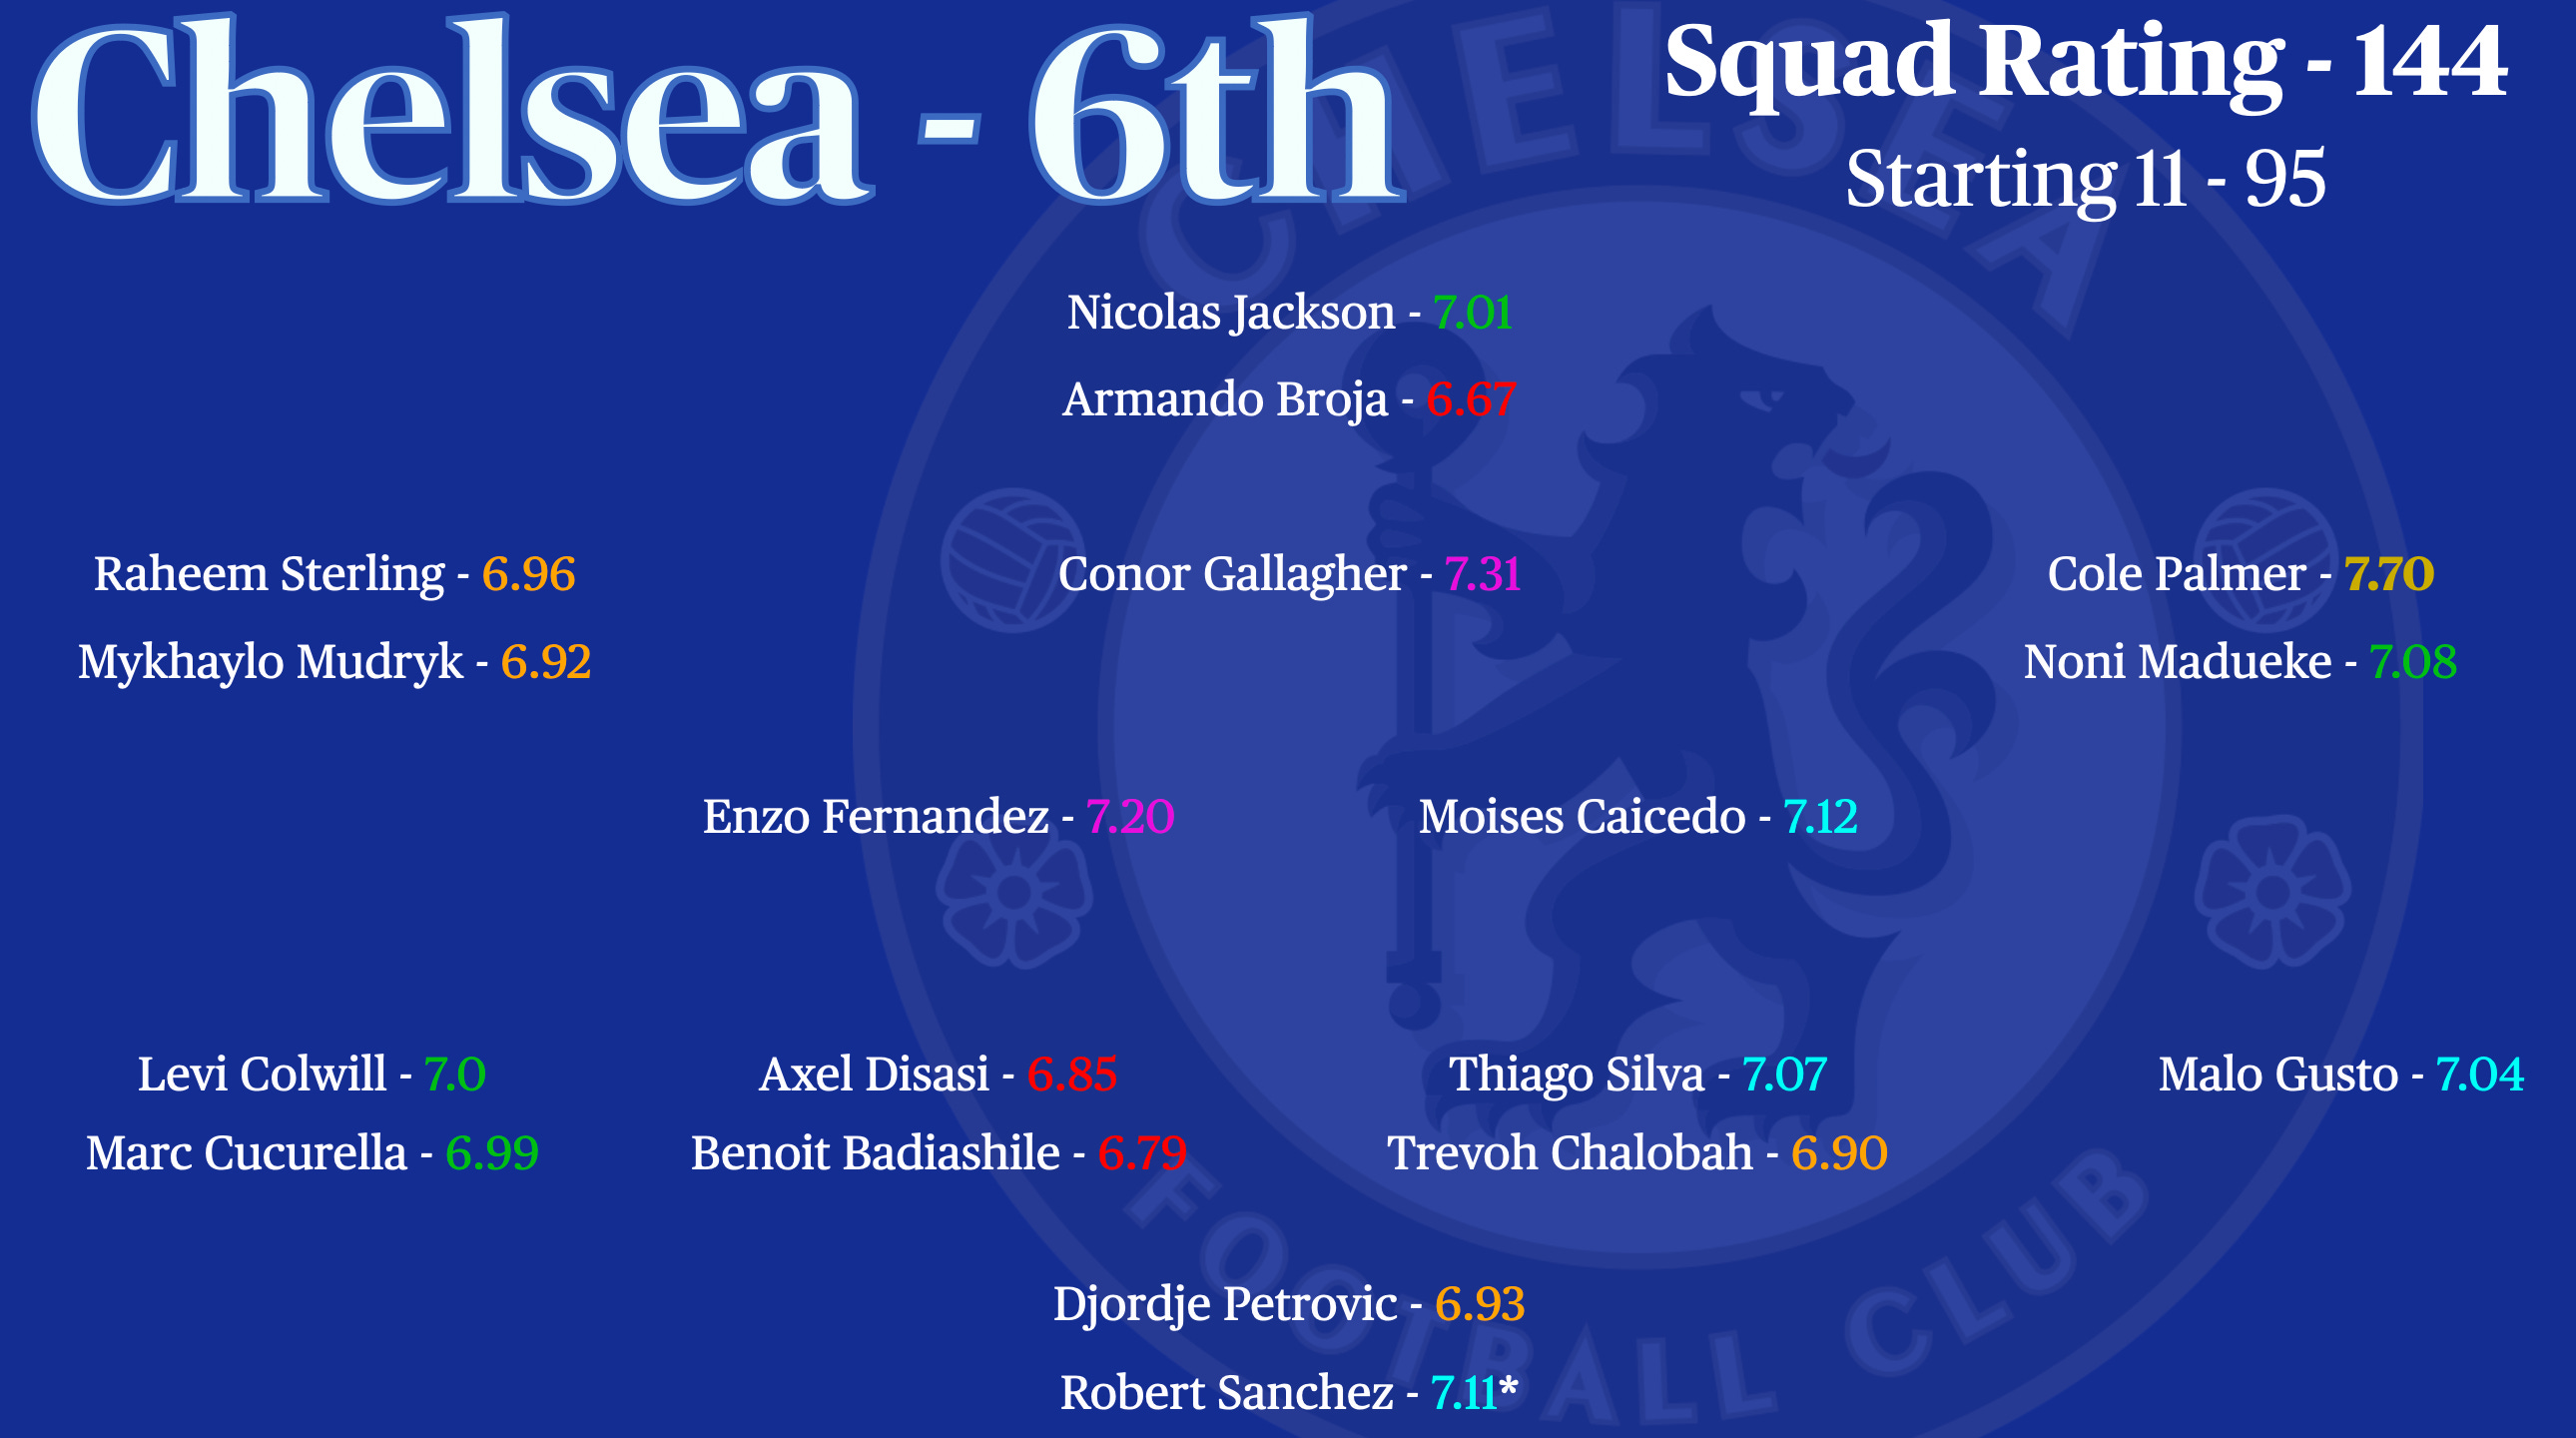
6th Squad Rating (—)
Continuing on trend with the experiment, Chelsea’s spot in the rating tables mirrored their league finish. Breaking it down, defense had mixed results—strong fullbacks are accompanied by Thiago Silva who lacked a consistent partner. The midfield trio was a highlight, each performing at a high level. Cole Palmer emerged as Chelsea's talisman, ranking top 5 league-wide, while Nicolas Jackson led the line solidly. Issues persisted on the left, with Mudryk and Sterling struggling. There weren’t major issues in terms of depth with some good options in different areas of the pitch.
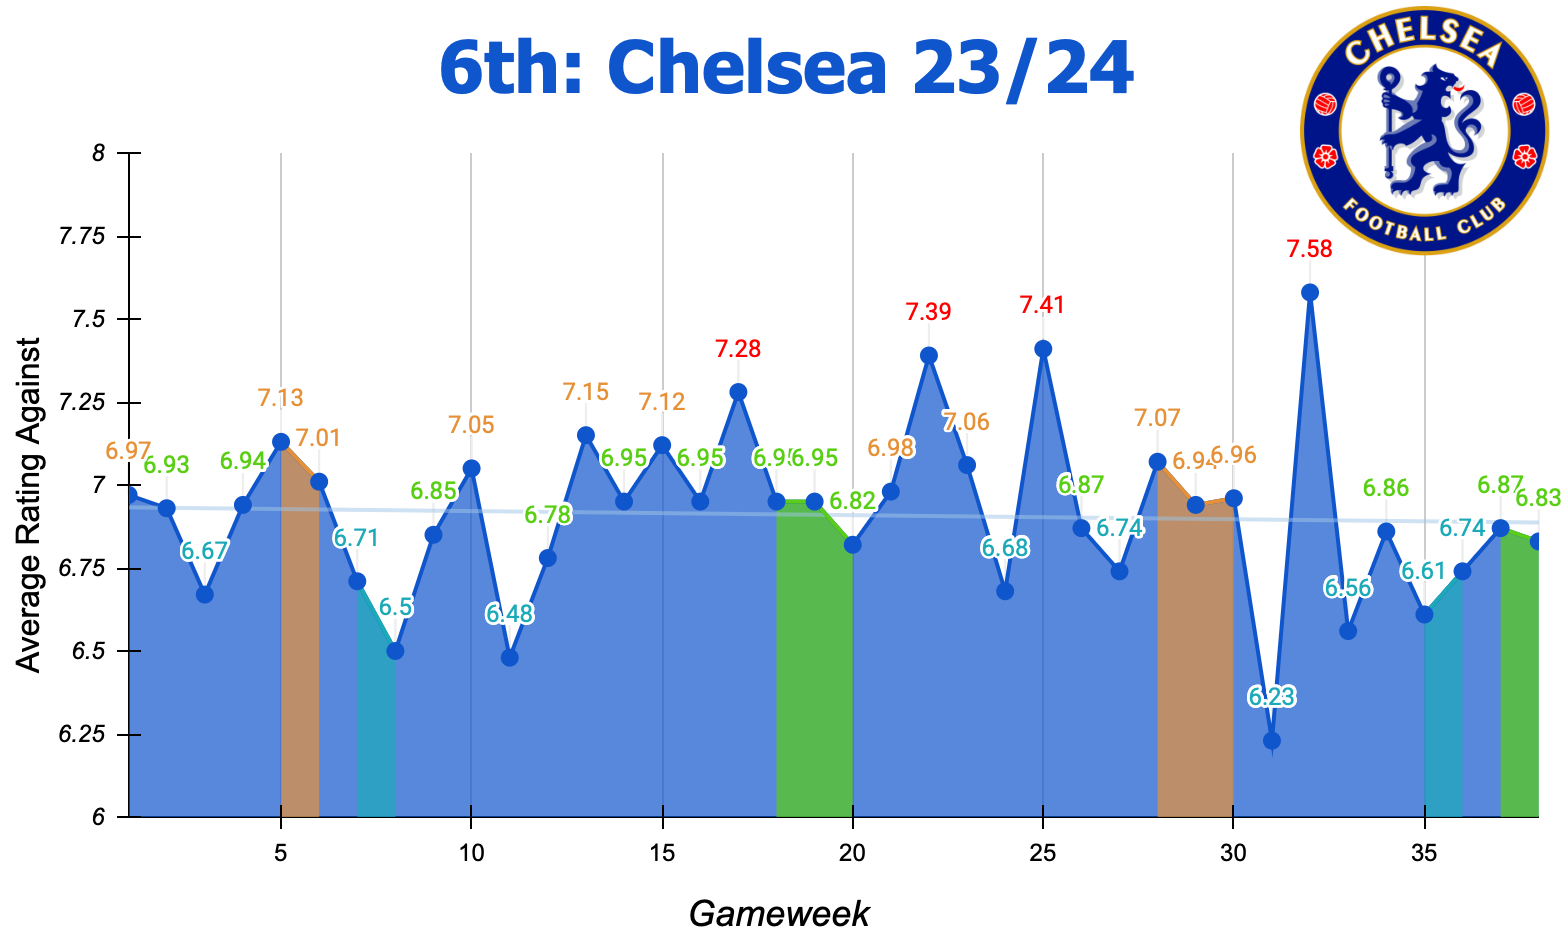
6th ARA (—)
With the narrative surrounding their season, I found Chelsea’s ARA to be quite surprising. They had a very strong start, without any extended poor spells. Midseason, their form dipped, leading to higher-than-usual conceded ratings. Going into the final quarter of the season, their form turns a corner and they kick on. The rating trend comes down pretty drastically with several elite performances, interrupted only by a 5-0 loss to Arsenal. It’s this form that would have got them to the Europa League had United not managed to win the FA Cup. The question it leaves me asking is whether they jumped the gun with Poch.
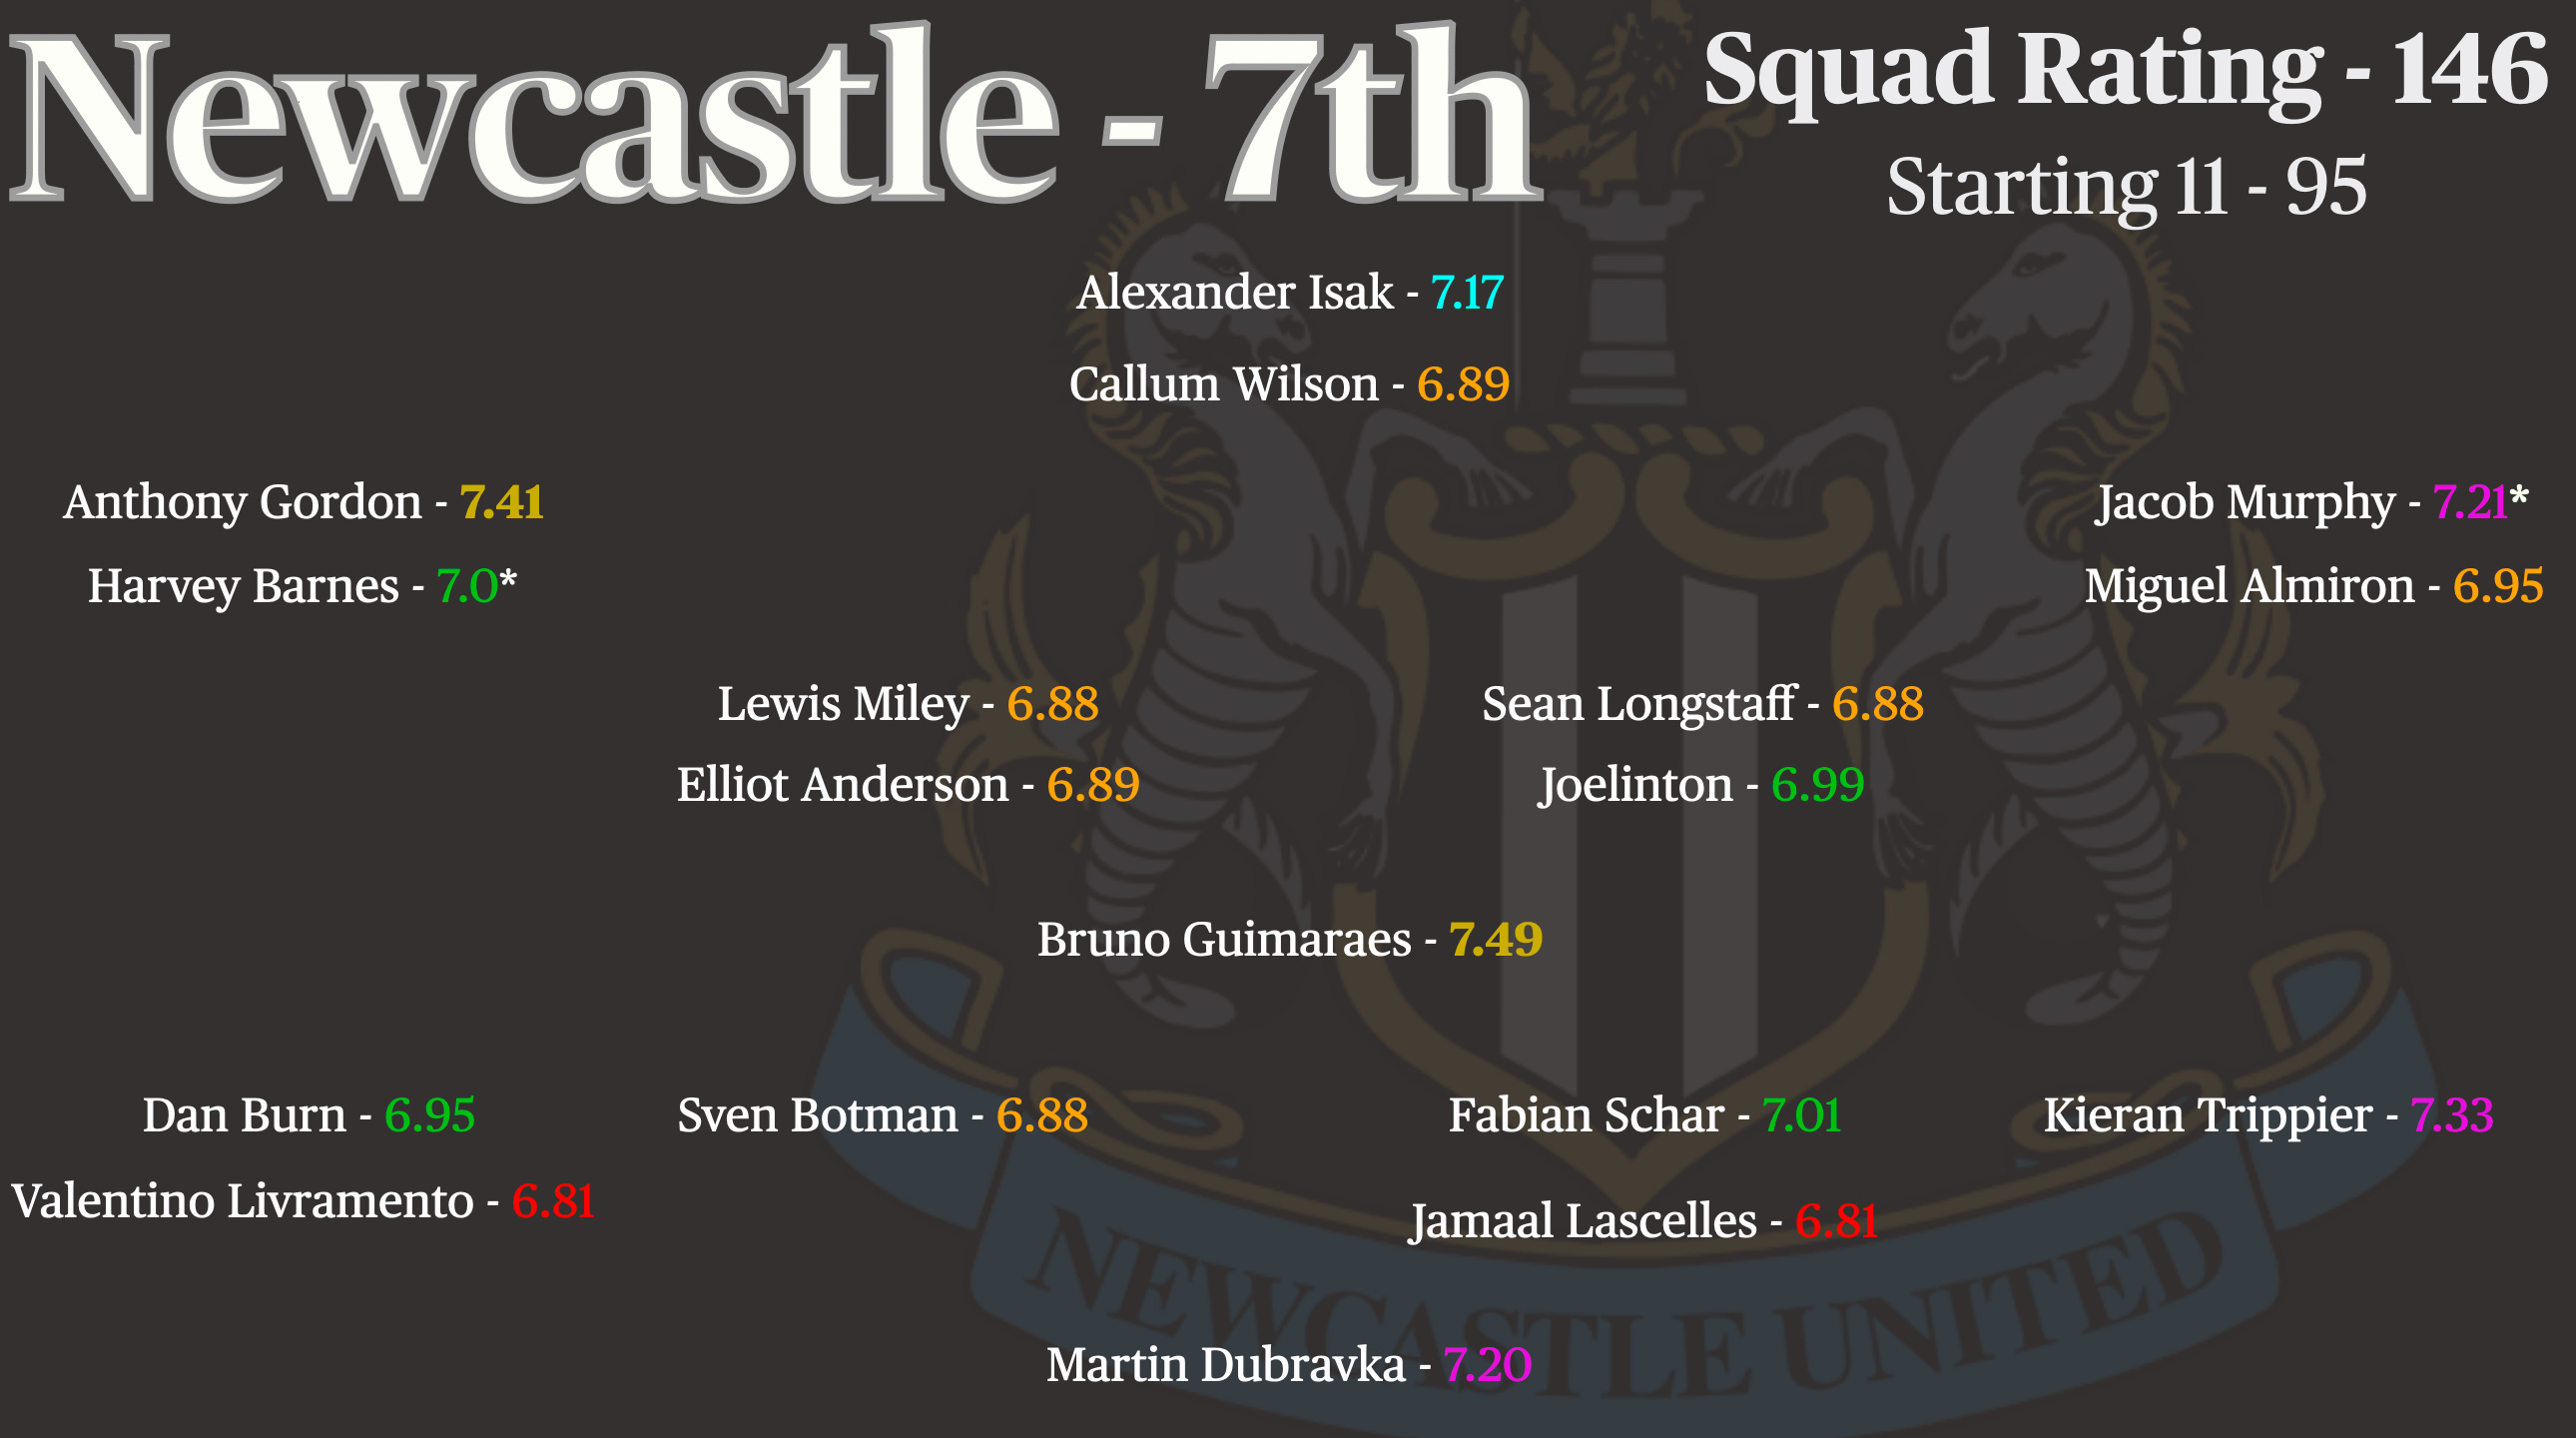
5th Squad Rating (+2)
After last season’s Champions League finish, Newcastle hoped to repeat their success but ended up 7th. The rating tables suggest they perhaps should have finished higher, though, and a closer look at the team highlights some reasons for the drop-off. Defensively, only Trippier maintained his level, while others slightly dropped off. In midfield Bruno stands out massively, ranking as one of the league’s best. However, his partners couldn’t match his level, creating a weakness. Up front, Gordon, Isak, and Murphy excelled, backed by solid depth in the attacking areas.
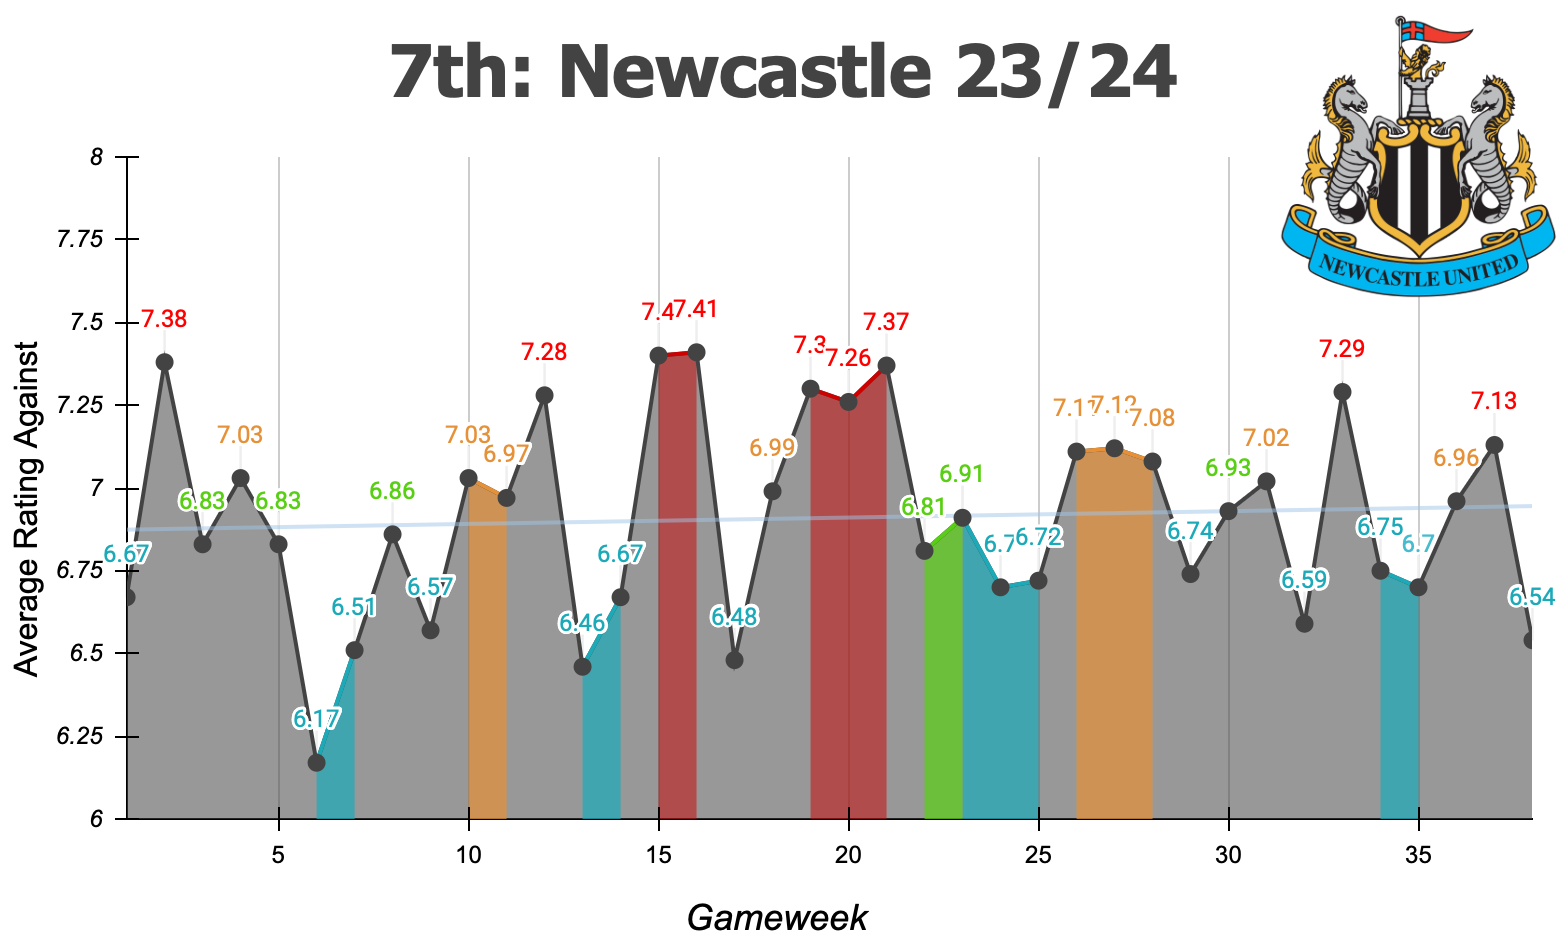
7th ARA (—)
Newcastle’s ARA shows a lower ranking than their squad rating, indicating strong attacking performances but inconsistent defensive form. The start of their season was actually pretty excellent, especially from GW5 onward. As we approached the early mid-season stage, their form seemed to drastically take a downturn. They are the first team we’ve analysed so far that had multiple red strips of performance. Though they rebounded in the season's latter half, inconsistency kept them from pushing higher—7th feels accurate for the Magpies.
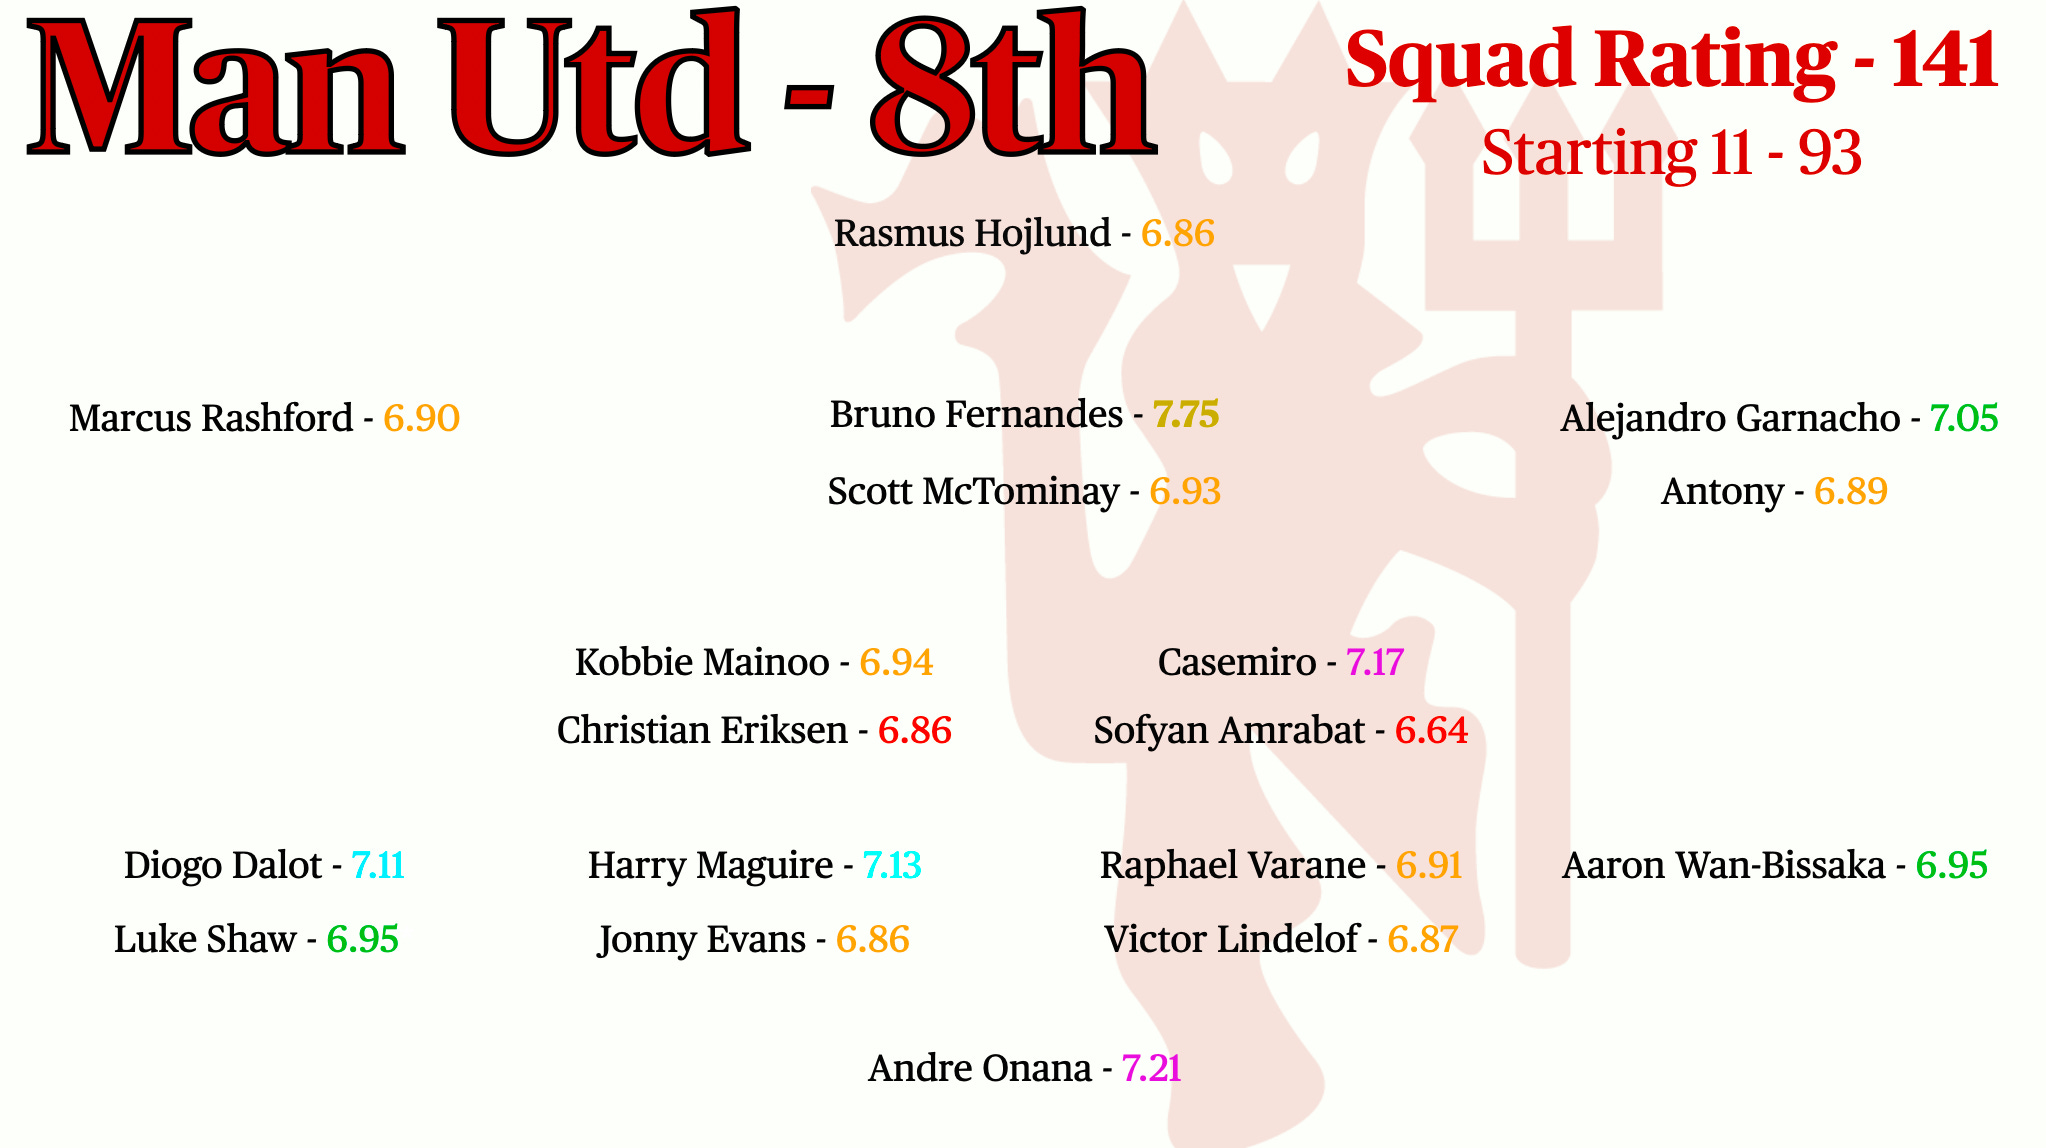
7th Squad Rating (+1)
After a strong 3rd-place finish in Ten Hag’s debut season, United’s hopes were high, but they fell to 8th in 23/24. Let’s see if we can understand why. Firstly, the rating tables rank them slightly better at 7th. Onana performed well despite undeserved criticism, and Maguire and Dalot held steady in defense. Casemiro, paired with young Mainoo, anchored the midfield respectably. But the real issue lay in attack: Fernandes was the star, yet Hojlund’s inexperience and Rashford’s struggles hurt the team. This lack of consistent attacking threat was key to their disappointing season.
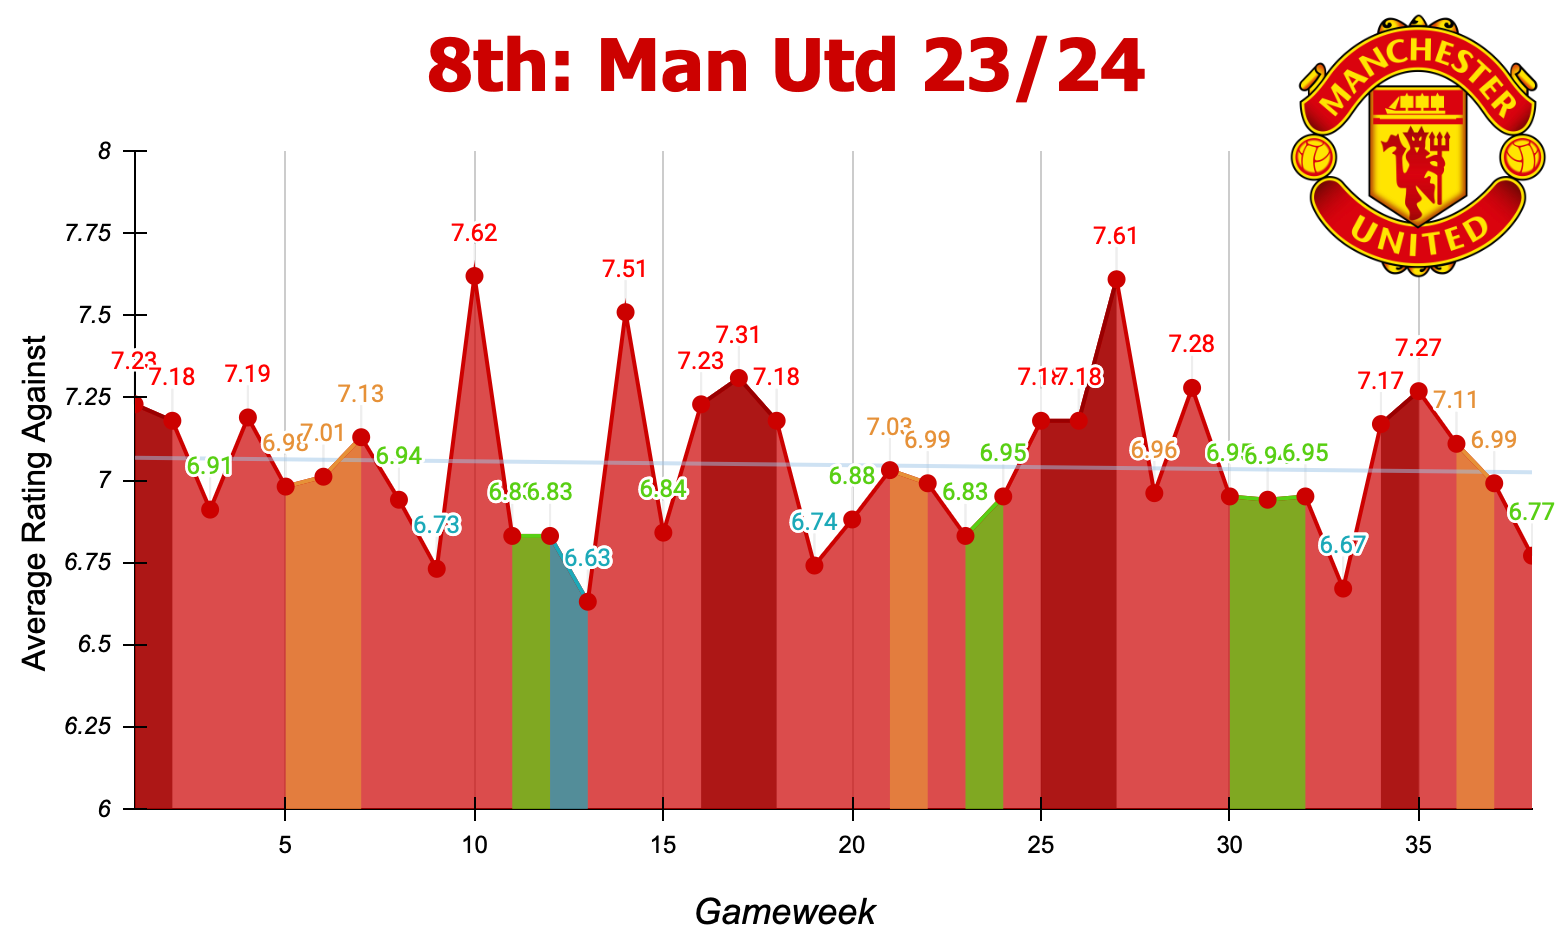
15th ARA (-7)
Fans may want to skip the ARA results, it’s very troubling for the Manchester side—United dropped 7 spots, landing 15th, suggesting they were far too easy to play against and lucky even to finish 8th. The graph tells the story. Their start was very poor and didn't massively improve except a slight upturn. After the halfway point, things do improve and the average conceded was kept lower. The trend for the season was clear: a few decent games amid mostly poor performances. I don’t try to bring personal perspective into these exercises but I think there’s much room for concern and Ten Hag can count himself lucky.
To avoid a lengthy post, I will just cover the top 8 teams in this part. In the 2nd part I will cover the rest as I won’t have to go back through the methodology. Stay tuned.